Contents
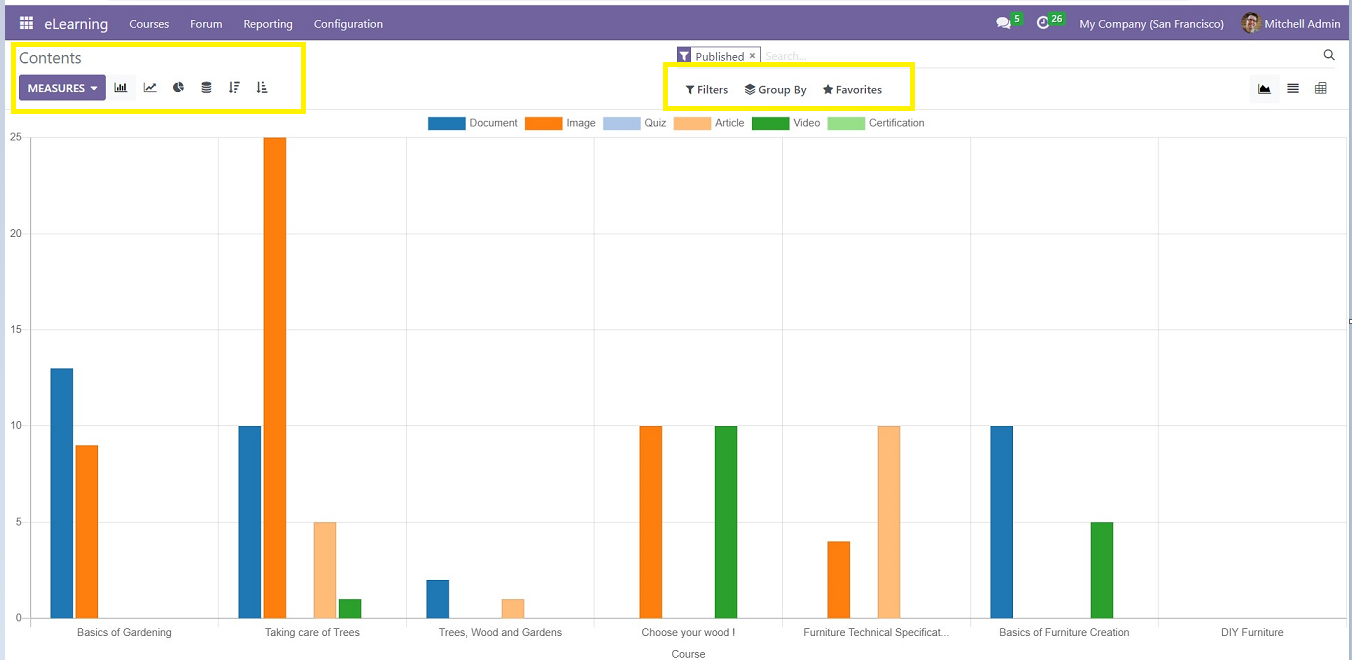
The Reporting menu in Odoo provides an extensive menu that makes it simple to analyze the Contents that have been created in the eLearning module, as shown in the screenshot below.

Here you can see the graphical view of the previously created content. You can alter the graphical view into a Pie Chart, bar Chart, Stack View, Ascending, Descending, and so on using the respective icons provided in the uppermost part of the page and change the reporting parameters using the “MEASURE” options dropdown list as you can see from the screenshot below.

Users can modify the report's metrics, including the number of articles, “Total views,” “Dislikes,” “Duration,” and “Likes.” You can group certain reports using the "Group by" option, sort the necessary data using the “Filter” option, and add particular reports to the "Favorites" section.
It is also possible to add custom filters and groups. Check out the "Add Custom Group" option provided in the Group by Option in the screenshot below.
