Sales Analysis
Sales reporting in the Odoo will help you to create reports to analyze the sales performance in a company during a fixed period of time. The company can use this report to improve sales performance and enhance productivity. Constant monitoring of your sales activities is essential to take suitable action and accurate decisions for the growth of your company. The reporting field in Odoo will give you a better understanding of all sales operations on a daily, weekly, monthly, and yearly basis.
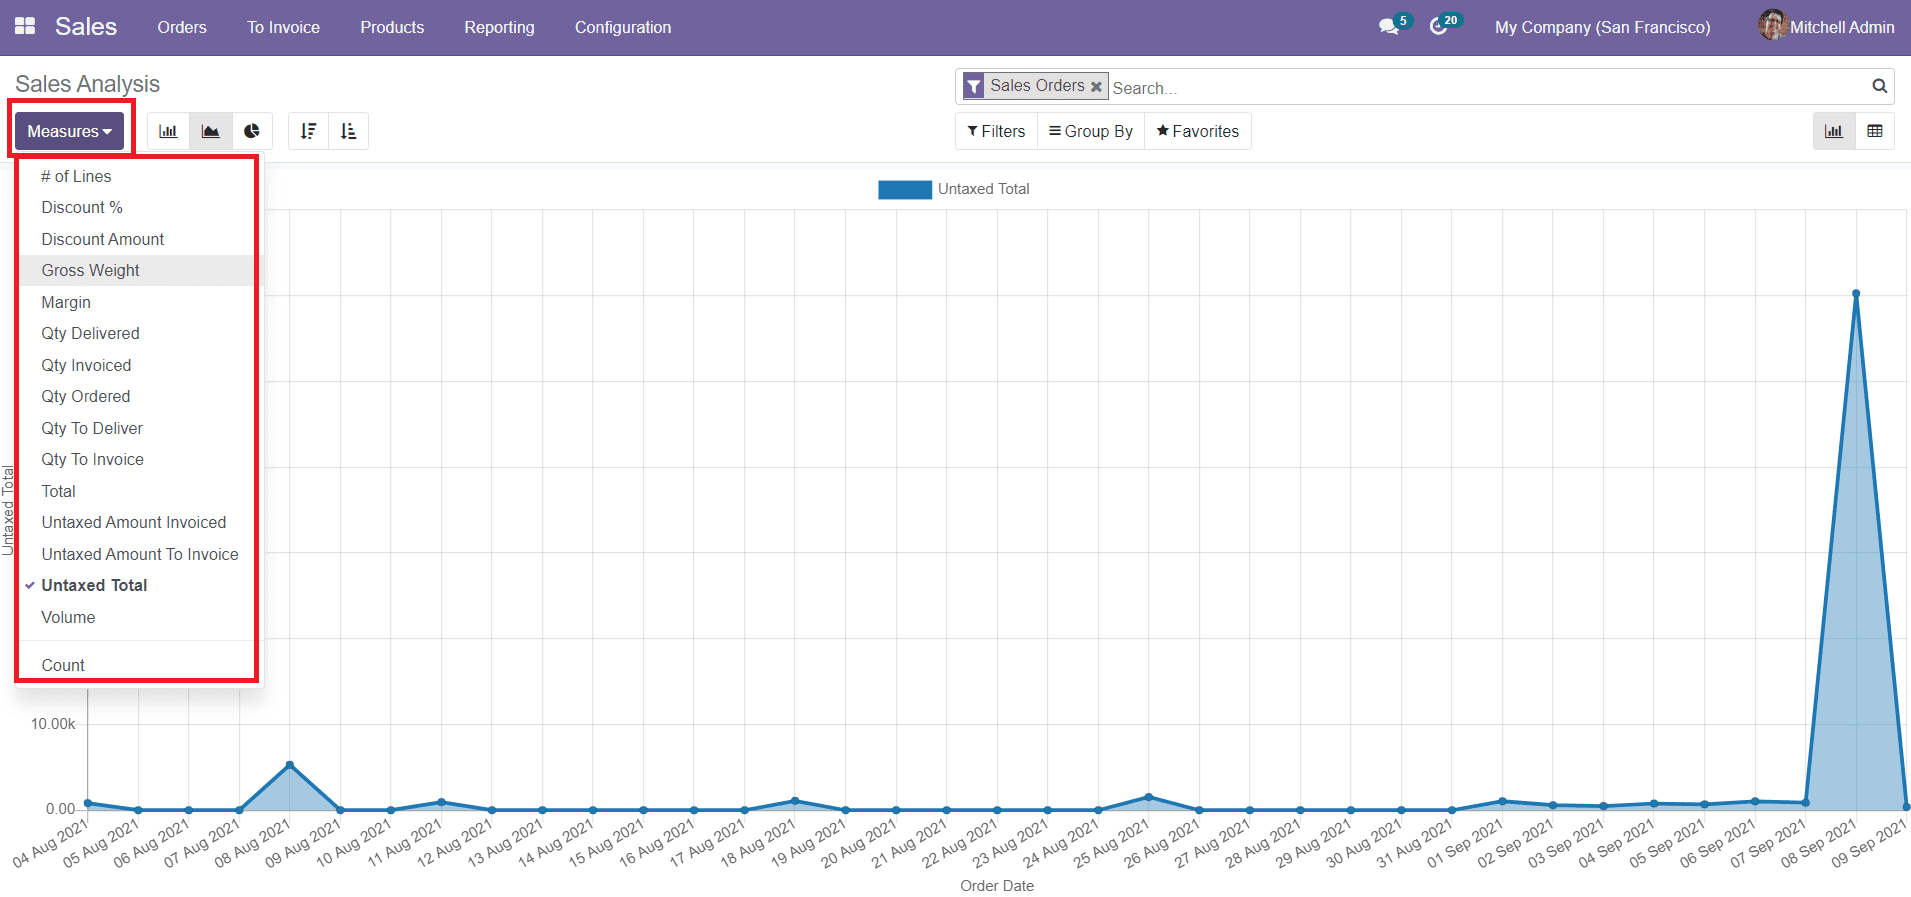
You can change the Measures of the report as per your requirements.
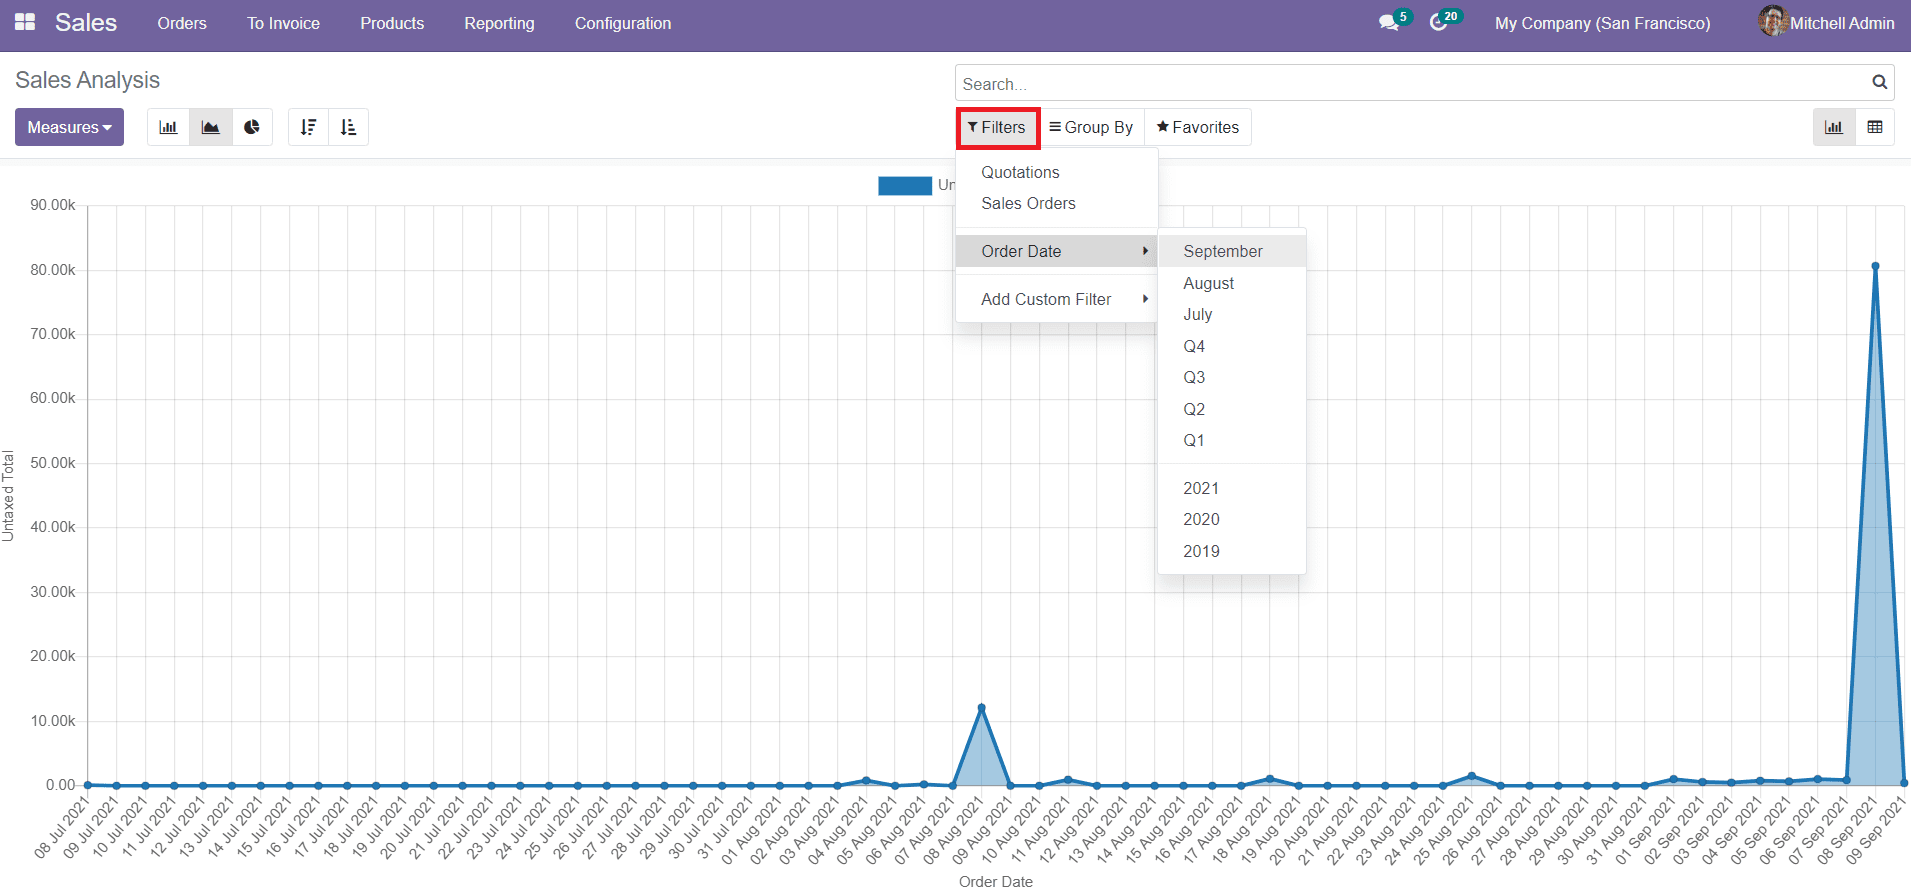
The Filters option will help you to create reports over Quotations as well as Sales Orders. You can customize the report by changing the measures and adding Custom Filters. The filters can be also used to create daily, weekly, monthly and yearly reports of sales and quotations.
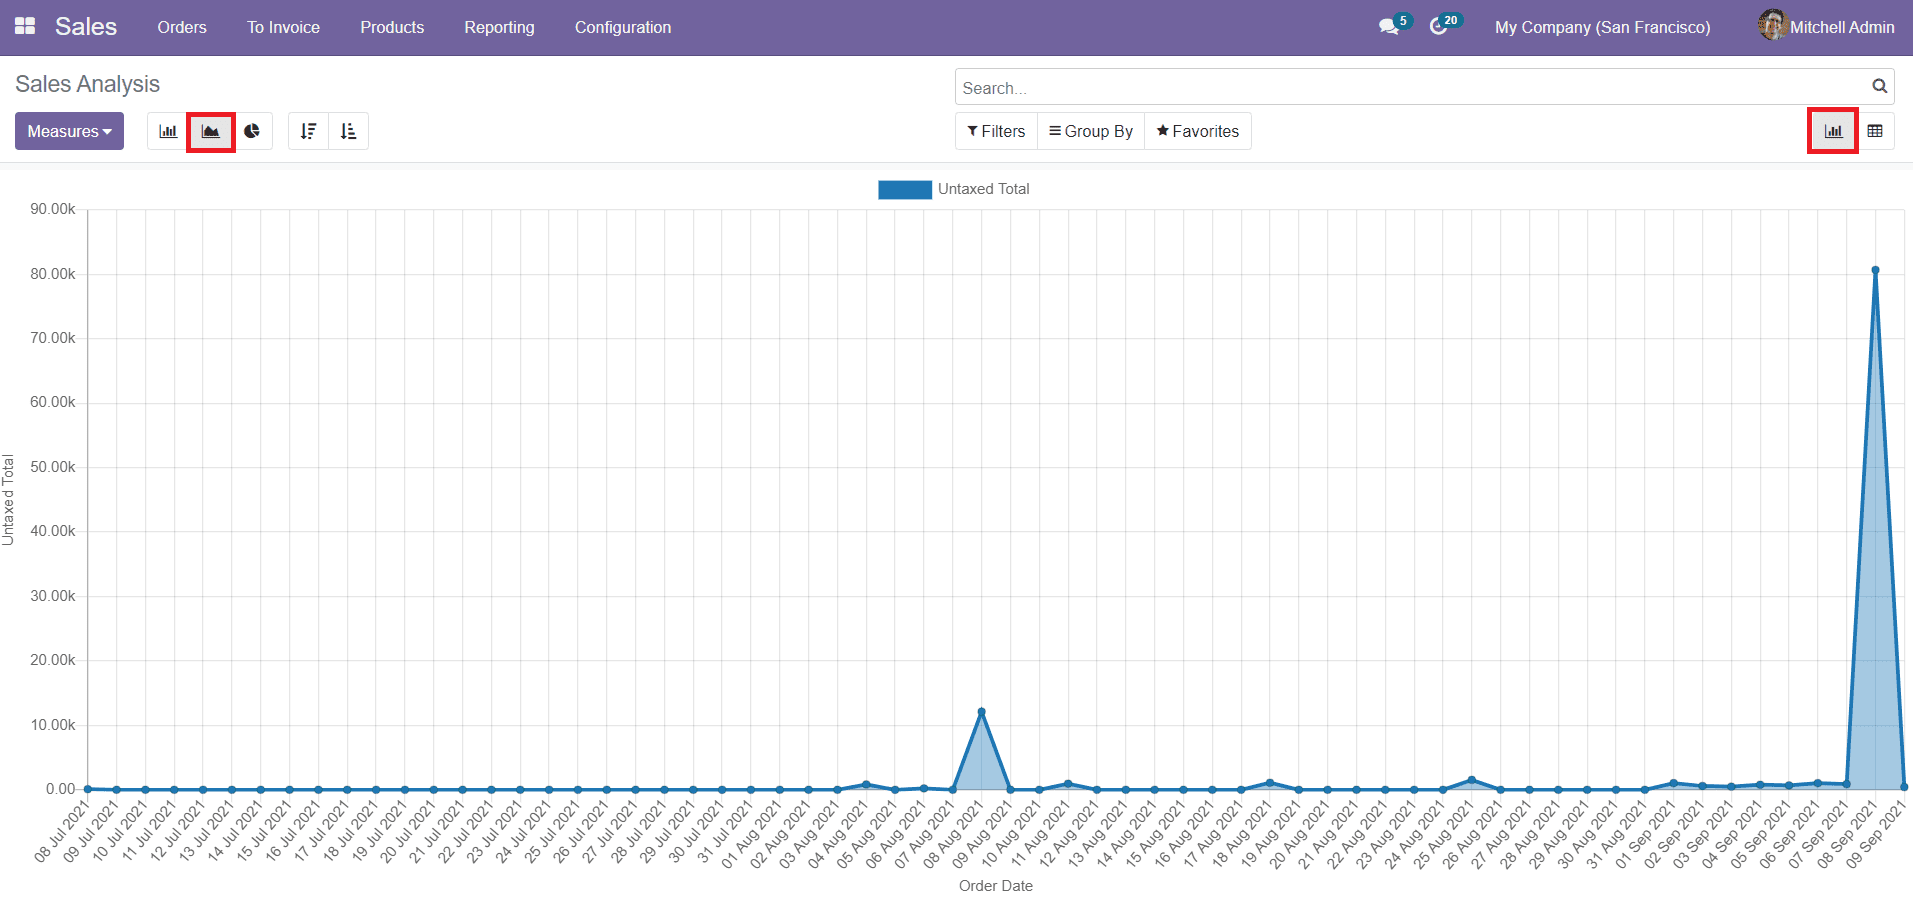
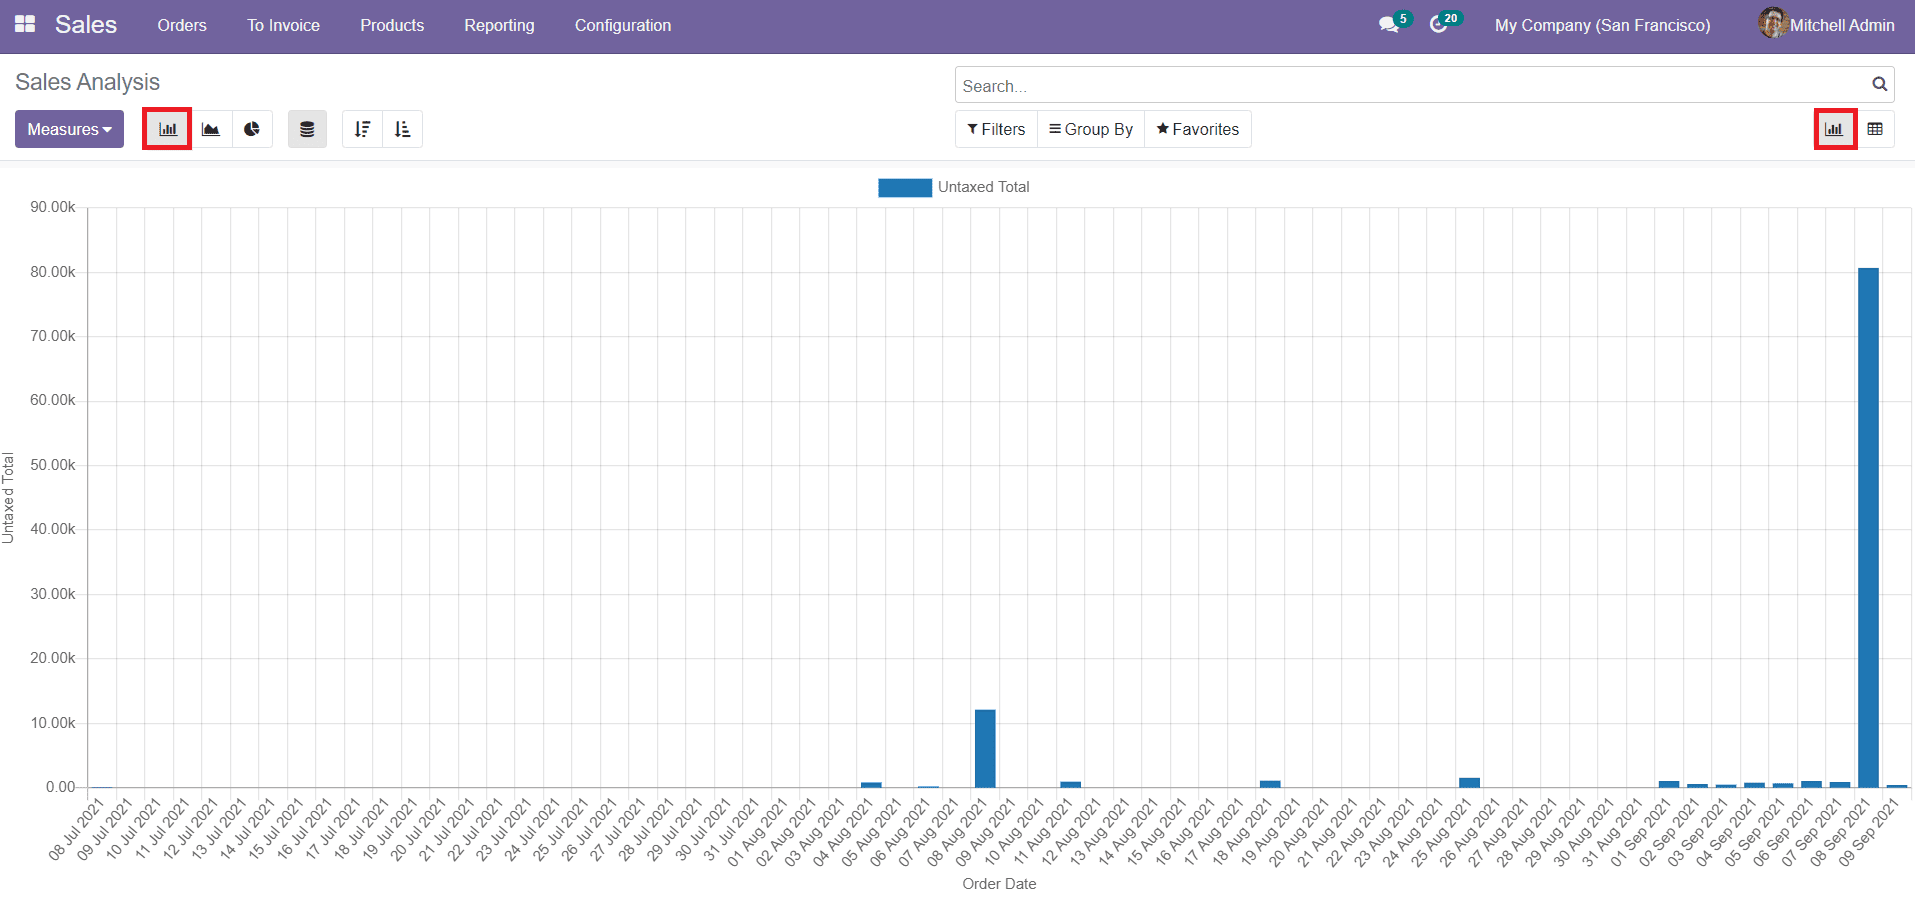
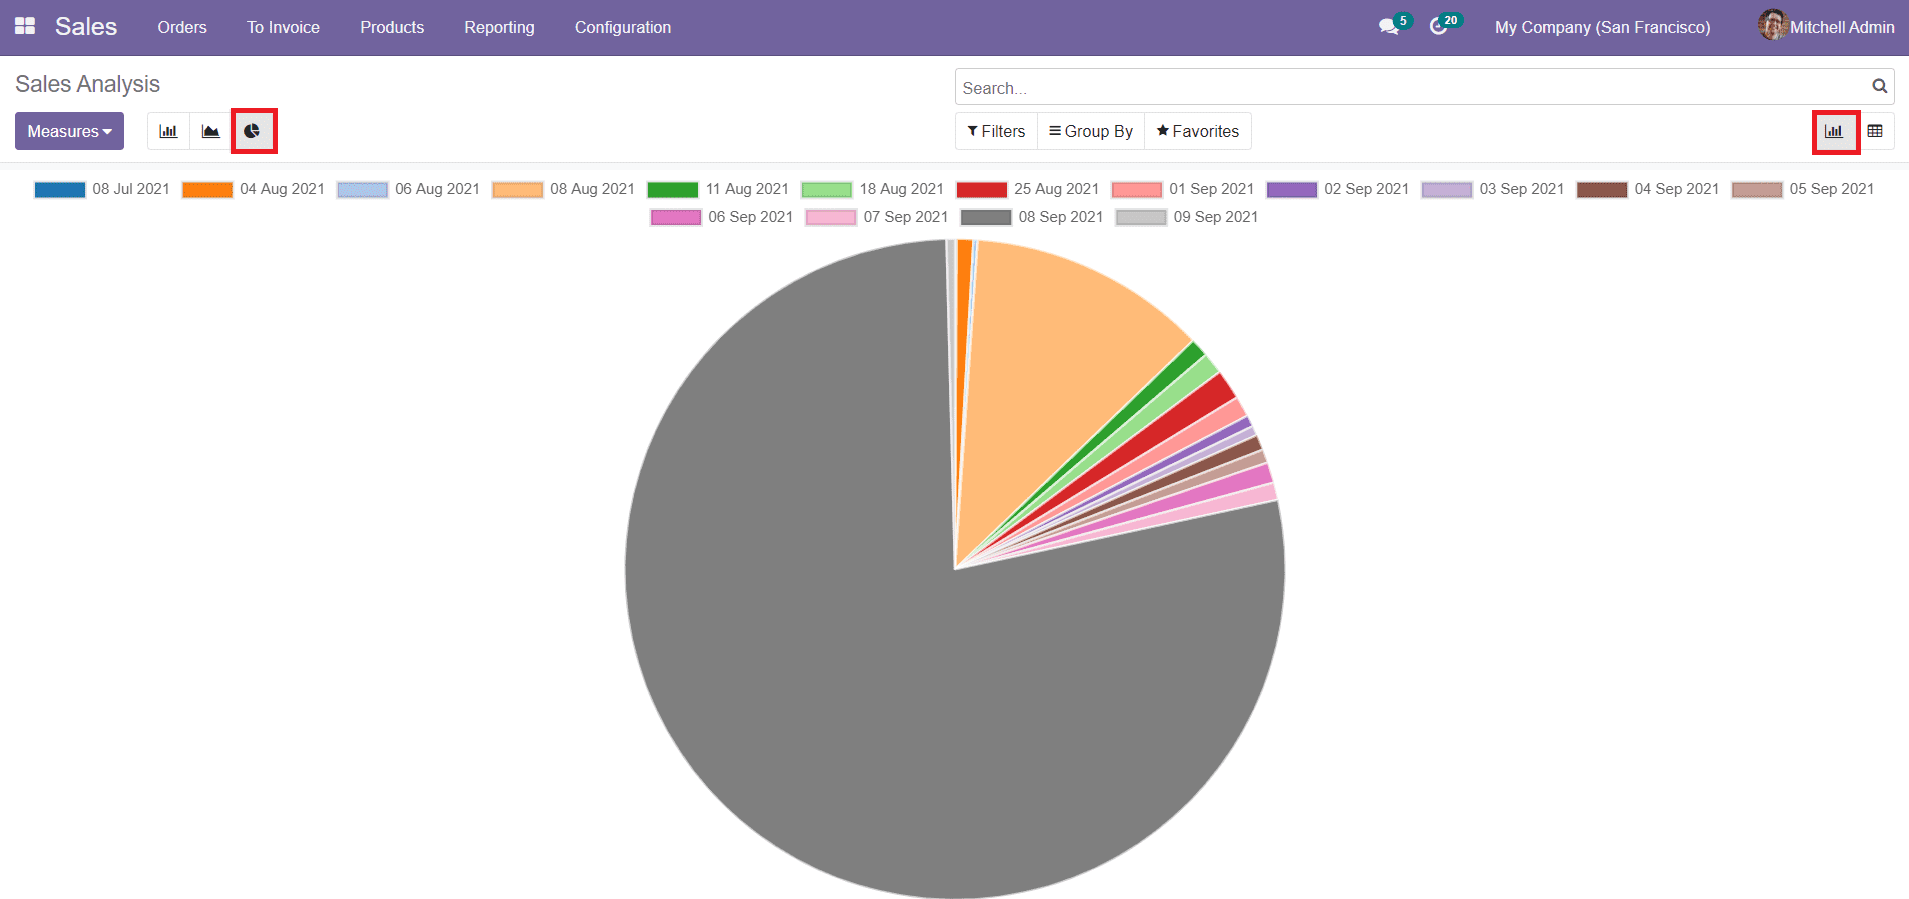
Odoo has facilitated Pivot and Graphical views of the reports. In the Graphical view of the sales reports, you have Bar Chart, Line Chart, and Pie Chart. The images of the Line, Bar, and Pie chart of the Sales Analysis are shown below.
Line Chart:-
Bar Chart:-
Pie Chart:-
In the Pivot view of the sales report, you can see the data in tabular form.

This platform will show options to Flix Axis, Expand, and Download into xlsx format.
The Sales module in Odoo will manage and organize all sales orders in the system in a well-structured manner and act as an easy quotation software for business practices.