Reporting
Like any other modules in Odoo, the events module also includes an efficient reporting
session. This will allow you to generate various analytical and quantitative reports
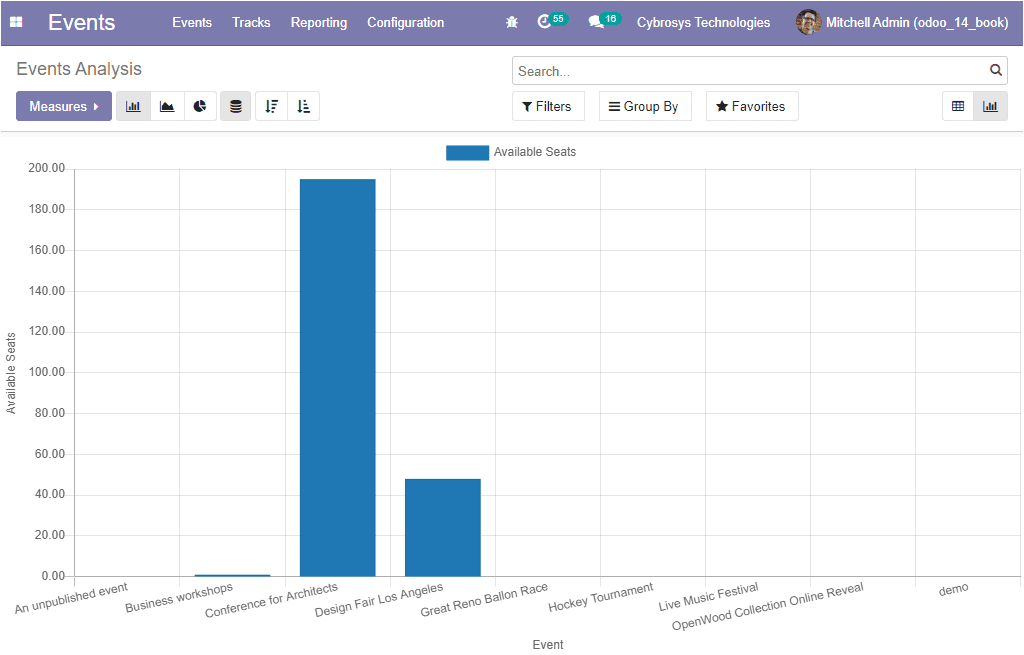
based on both events and attendees. The Events analysis window can be viewed in
both Pivot and Graph view. The various measures can be viewed in Bar, Line, and
Pie charts. The image of the window is depicted below. This is the graph view of
the events analysis window.

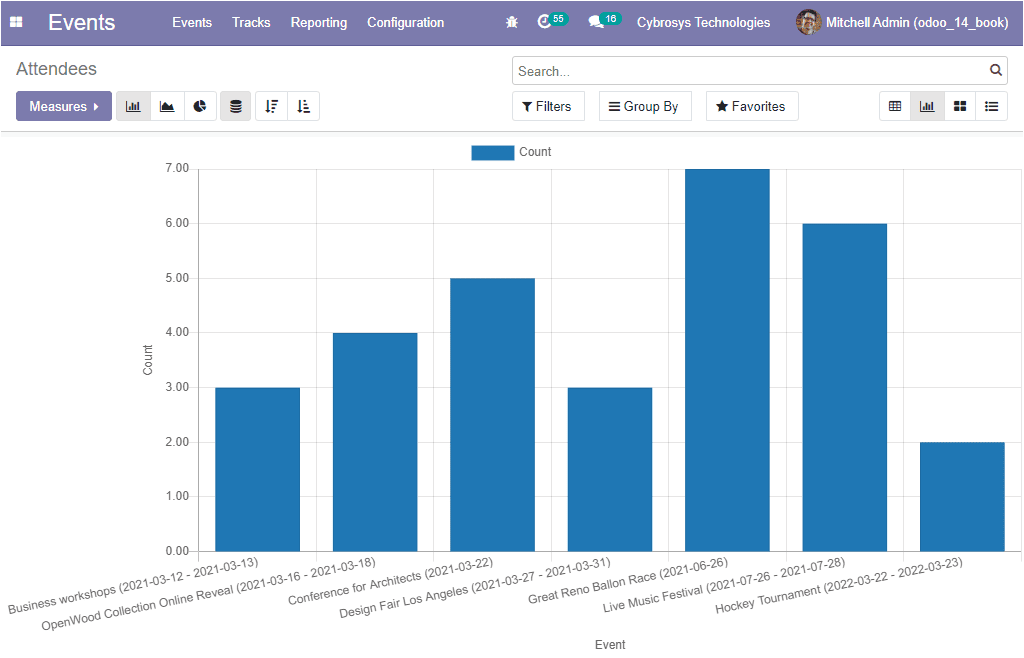
In the same way, the Attendees analysis windows can also be viewed. The graph view
representation of the window is depicted below.

The various customization options for filtering, group by, sort out and favorite
searches can also be created. Now we are clear about the features of the Odoo Events
module and we are sure that this module can practically manage any of your events
and the attendees in a perfect way.