A project's management and completion will be taxed if it is not set up in a systematic way. Each organization implements a suitable management system to simplify job administration for individual corporate initiatives. Planning, task development, work assignments, timesheet recording, completion of milestones, and billing for finished projects are all included in project management. There was a one-stop shop for the efficient handling of all a company's projects. To manage projects in an organized manner, you could use the most recent version of Odoo. Projects can be created and tracked using the Project module. Project management will be carried out methodically because the user can separate a project.
Management reporting definition refers to a method of delivering critical facts to managers at all levels in order to assist them in making informed operational decisions. As a result, decision-makers at a corporation can improve business efficiency and performance. Management reporting is classified into three types: analytical, operational, and internal reports. Sales and marketing reports and planned reports are two examples.
In contrast to financial reporting, management reporting entails gathering information for internal use. After analyzing the data's size, kind, and nature, individuals must choose a management reporting approach.
A robust and user-friendly reporting capability is available in the Odoo ERP software. Odoo's modules all contain reporting features that let you create a range of reports in a range of formats. By using this reporting system, we will be able to evaluate our company's performance and take the necessary steps to make improvements.
The MEASURES tab can be used to view the reports in different measures. These kinds of reports will assist you as an organization's responsible individual or manager in looking over the earnings and quickly comprehending your profits. Additionally, you can access all configurable and standard features like Favorite Search and Filters. These choices are visible at the window's top. You can limit your report's data display to your chosen data using the advanced search view option. This is accomplished by choosing the magnifying glass symbol at the end of the search bar menu. You can arrange the information using the Group By and Filters options.
The project team and stakeholders are left in the dark and unable to pinpoint what is going on with the project without sufficient project management reports. Because the necessary insights aren't coming through and the proper judgments aren't being made, it's all too simple for the project to fail. Project reporting satisfies the requirement for information in the project management process by moving data from its point of generation to its point of interpretation and application. Management reporting definition refers to the information gathered and supplied to a company's decision-makers to assist them in running operations efficiently. Managers use this application to track key performance indicators (KPIs), make sound business decisions, and compare the company's performance to that of competitors. These judgments might range from determining how many personnel should be on a team to minimizing costs.
These reports are often provided on a regular basis and may include information about operations, customers, money, and so on. Project management reports are crucial in general since they demonstrate the work being done so that the project team can discuss how it works and concentrate more on it, identify what isn't working so the team can look into it and decide, with the aid of the project dashboard, what to do about it, provides a 360-degree perspective of the project to the team so they can decide what to do next. Project managers can convey crucial information to stakeholders via project management reports, which are an essential tool. They can offer a succinct summary of a project's present state and give management and stakeholders the opportunity to make any necessary adjustments. Learning more about project management reports and their significance may be helpful if you work in project management.
Project management reports may be used for a variety of purposes, such as updating project stakeholders and managers. Predicting possible risks before they materialize can help project managers keep their initiatives on track. Controlling project expenses and action-sharing with the team.
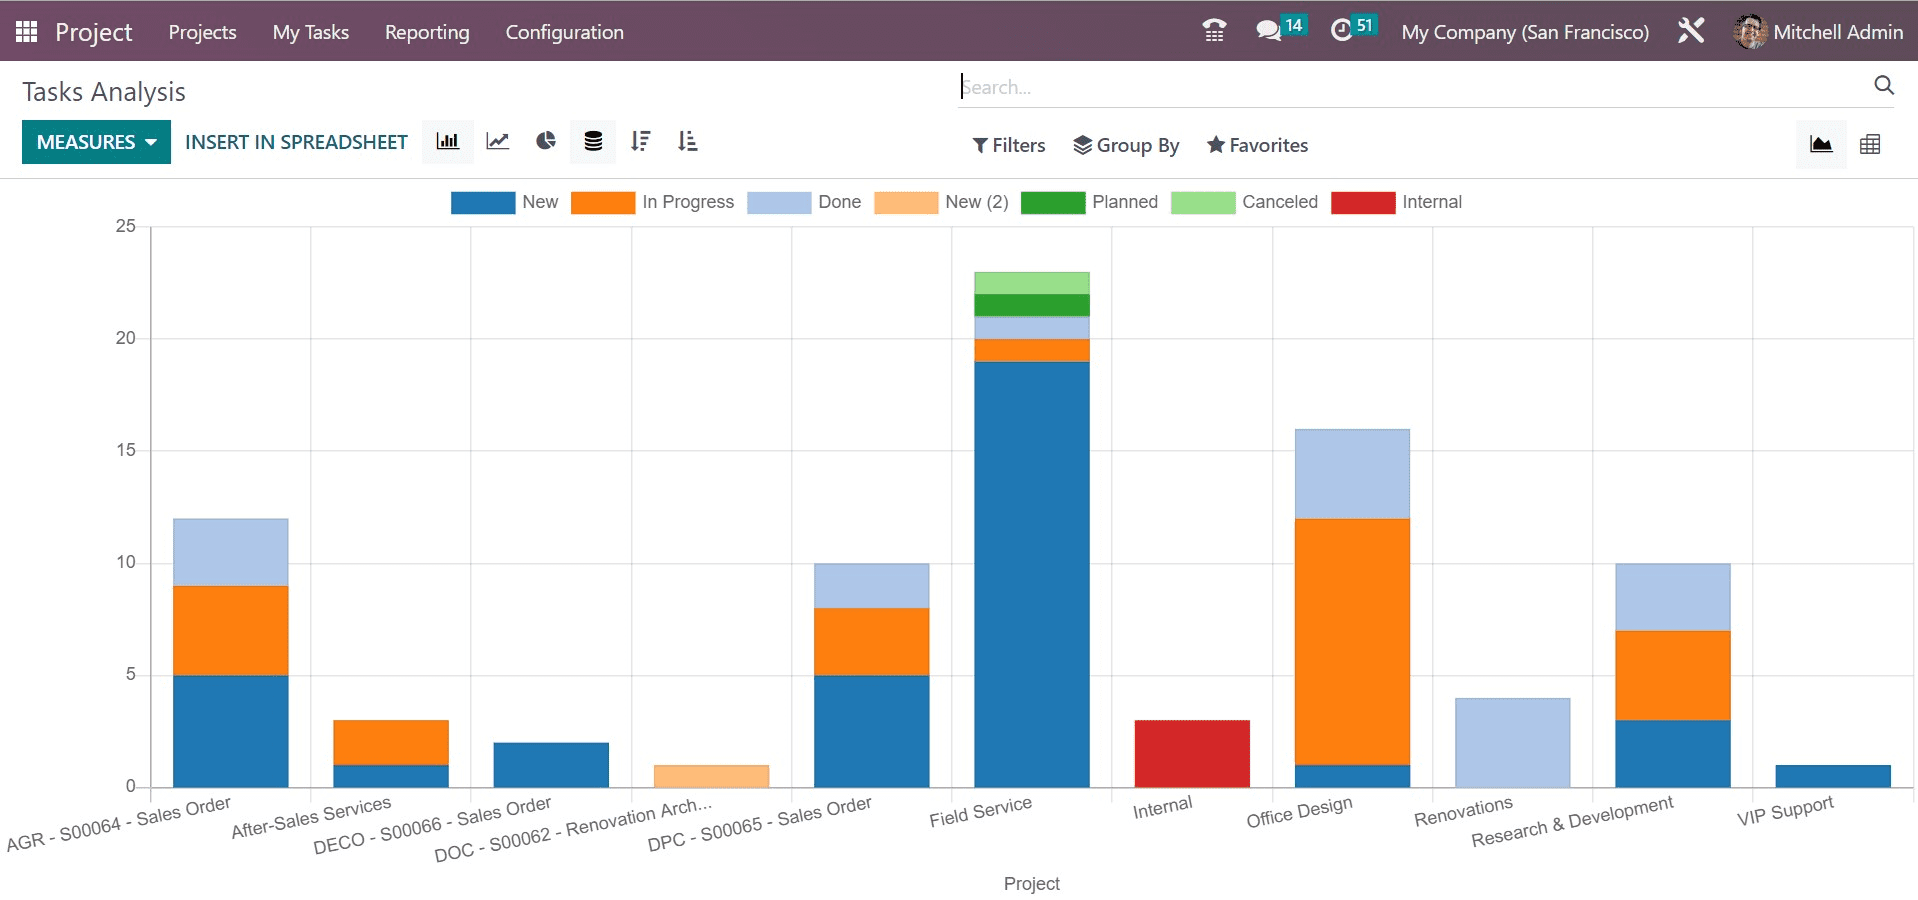
The page of reporting in the project management will be, as shown in the screenshot below.
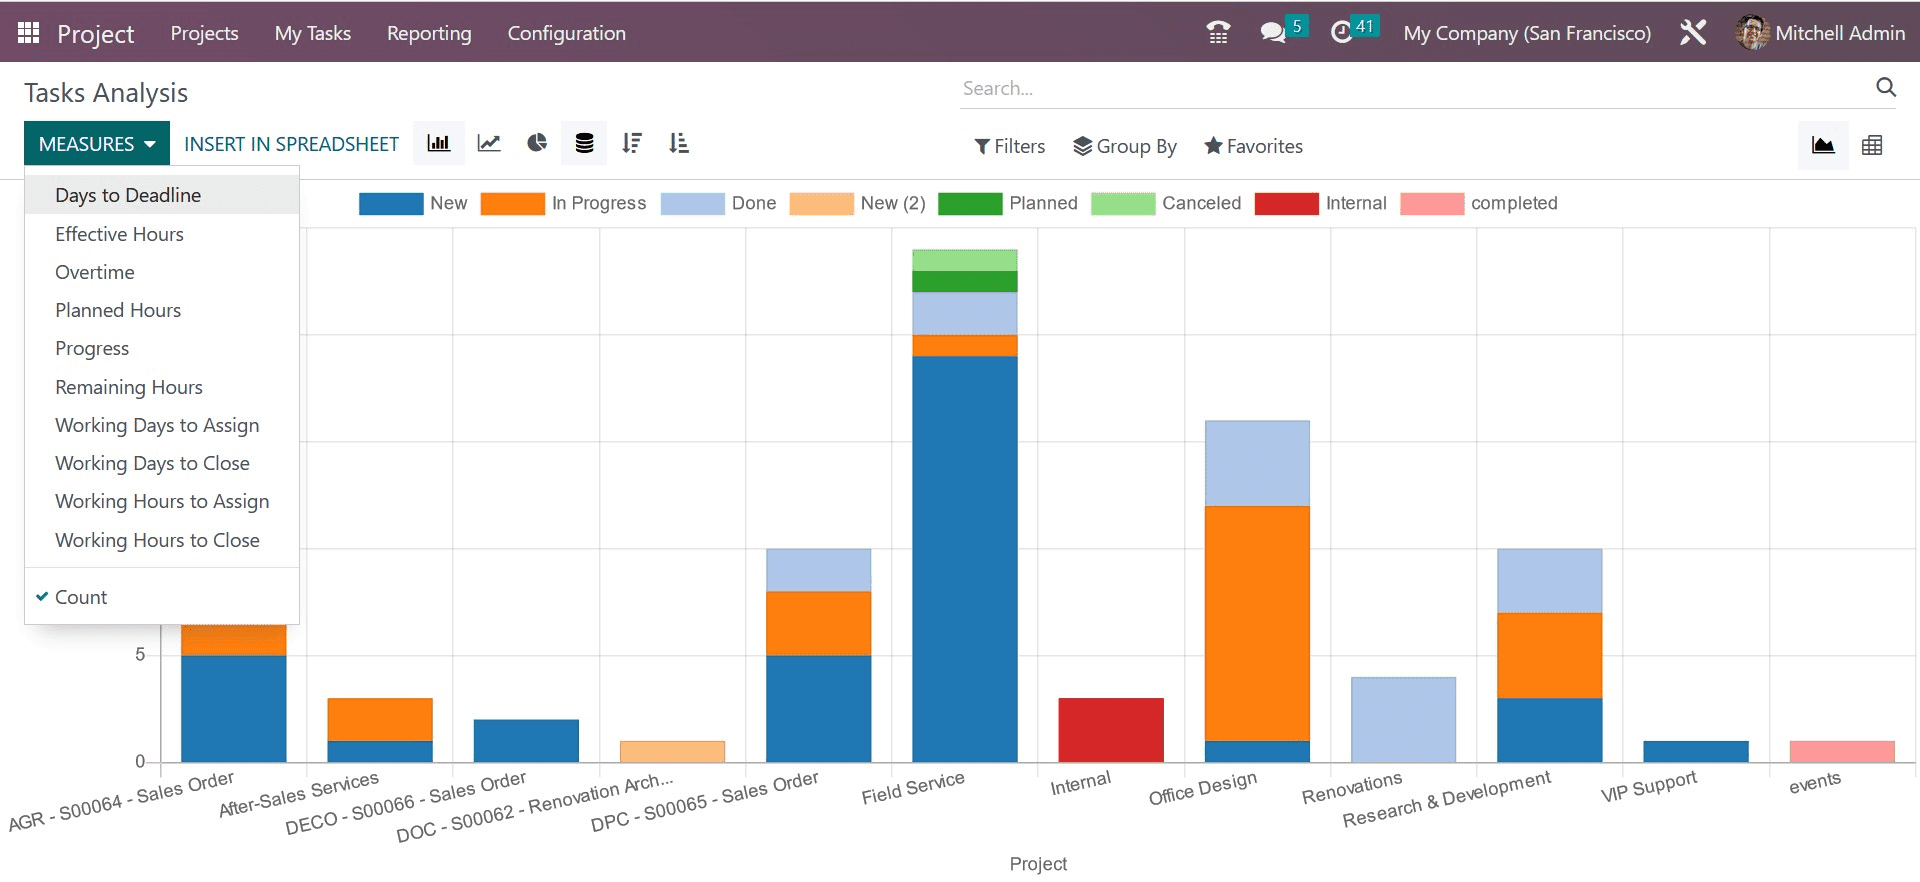
Here, as mentioned before, you can have the measures such as days to deadline, effective hours, overtime, planned hours, progress, remaining hours, working days to assign, working days to close, working hours to assign, working hours to close, and count, respectively, as shown in the screenshot below.
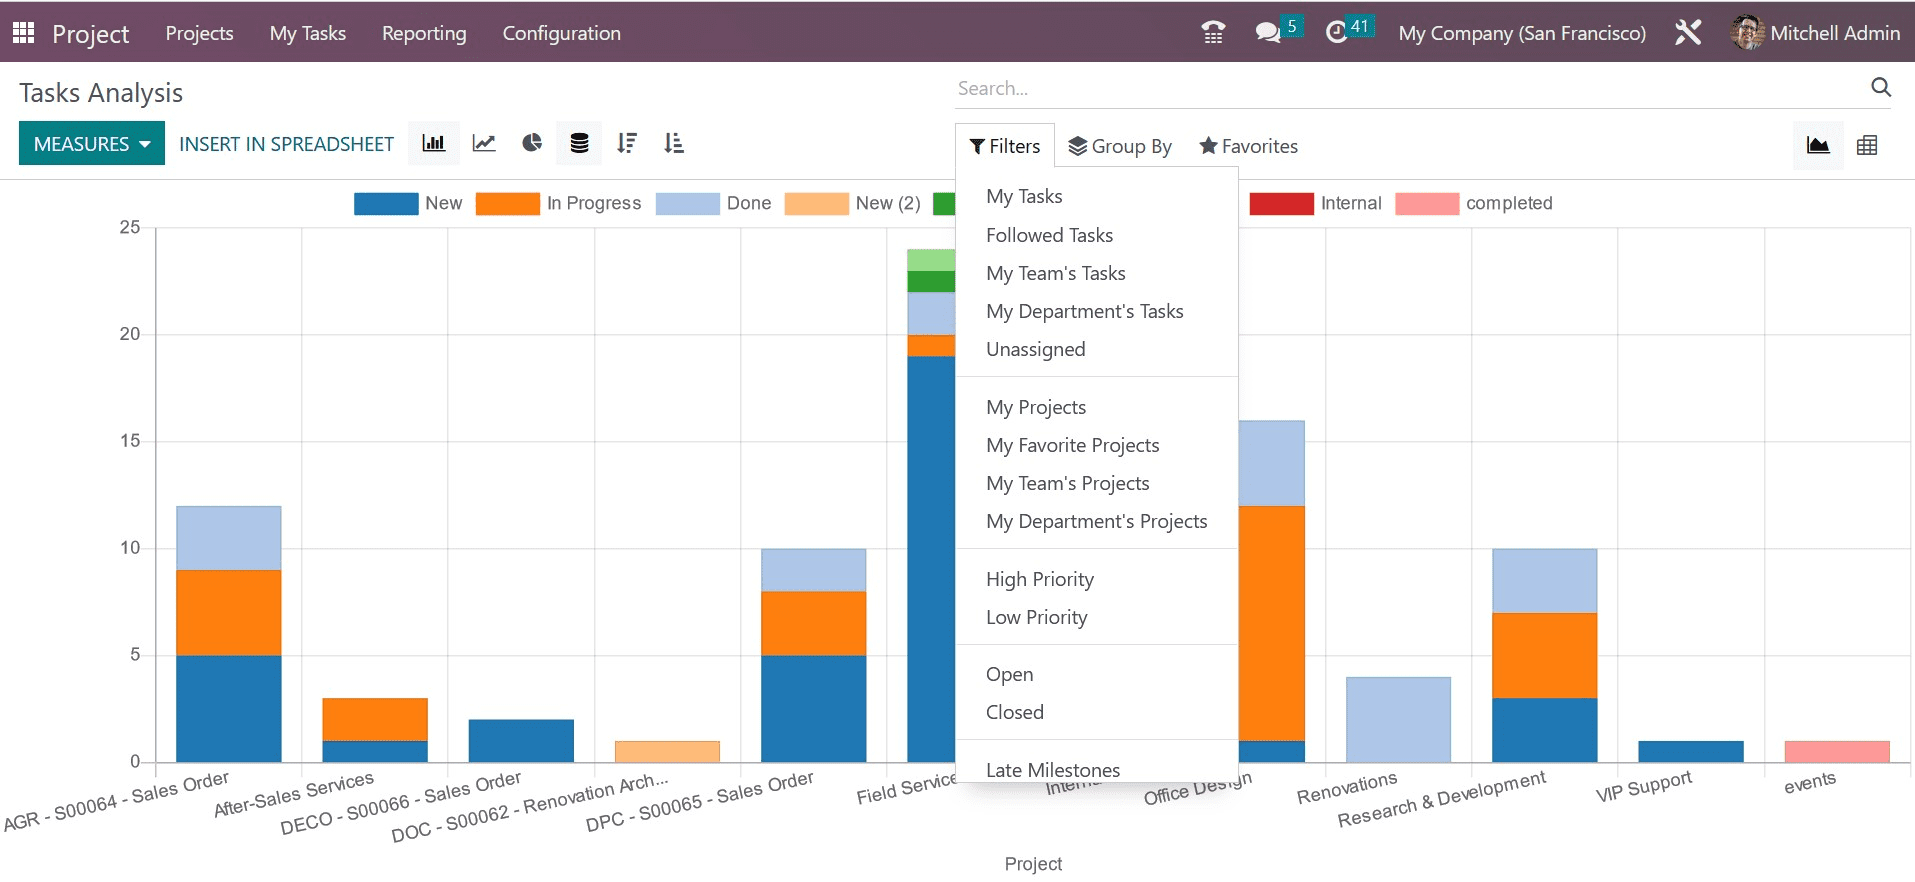
Under the filters option, you will get the sub-options, such as my task, followed task, my team’s task, my department’s task, unassigned, my projects, my favorite projects, my team’s project, my department’s project, high priority, low priority, opened, closed, late milestone, late task, tasks in overtime, deadline, assignment date, last stage update, archived, and add a custom filter, respectively, as in the image below.
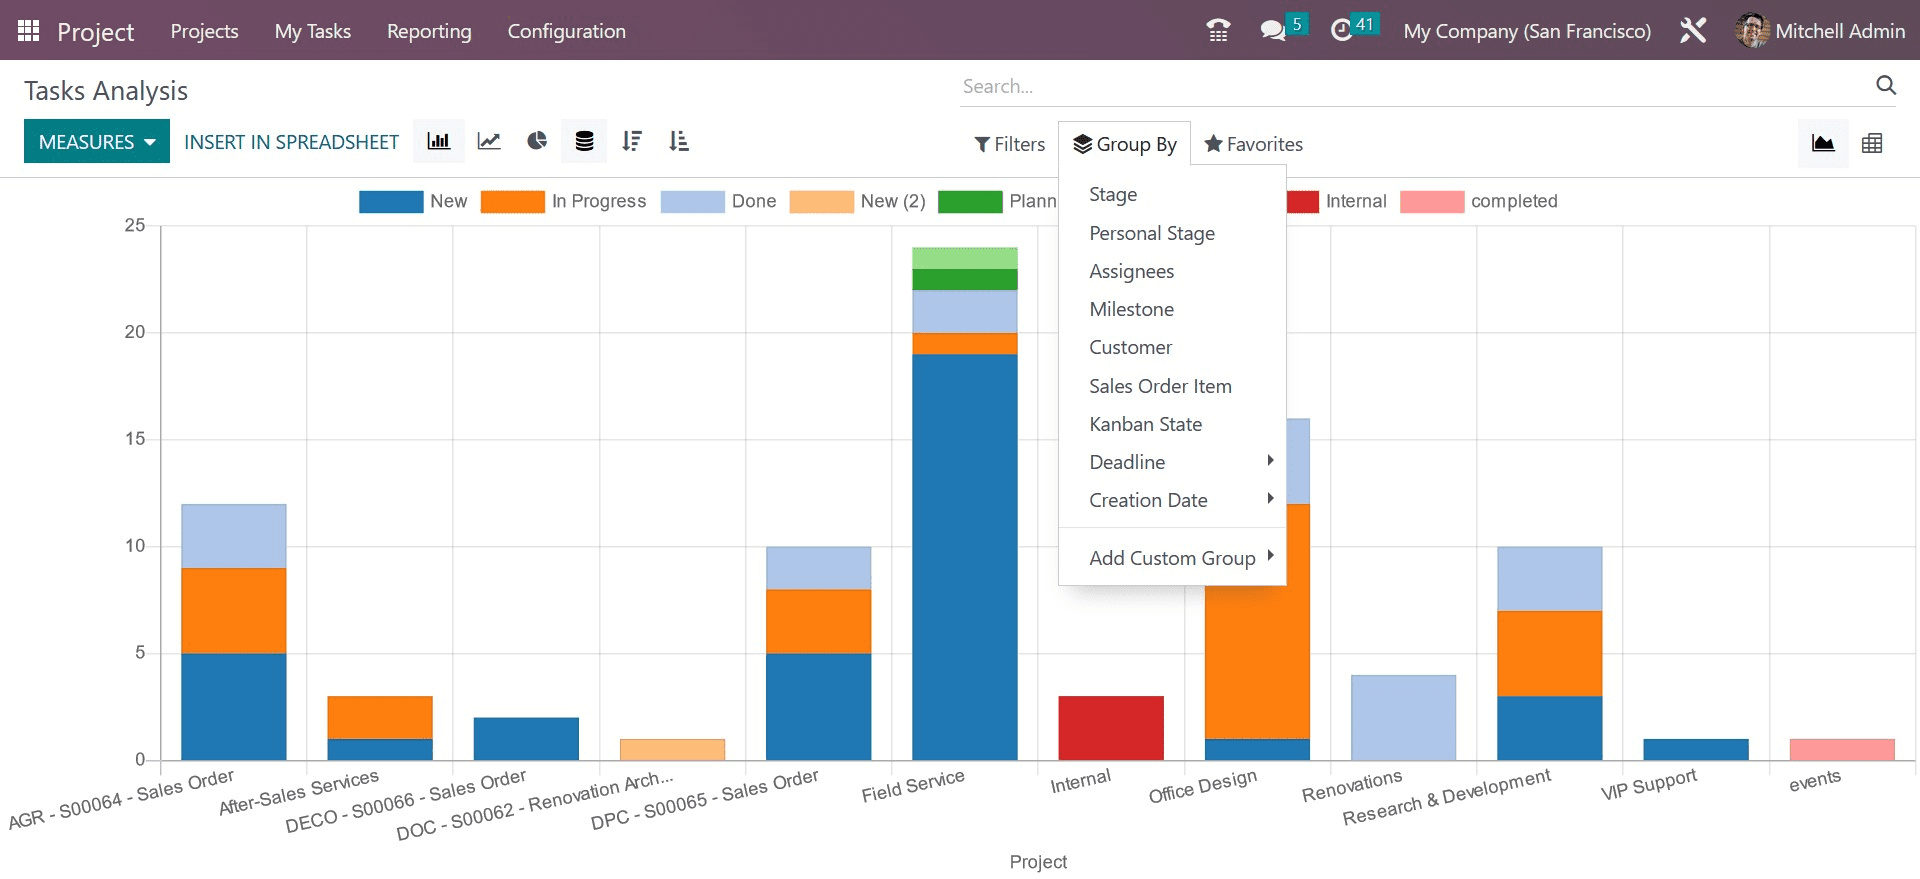
Now, under the group by, you can make use of the options, such as stage, personal stage, assignees, milestone, customer, kanban state, deadline, creation date, and add custom group, respectively.
In the favorites, you can have the save current search option if required. The page can also be viewed in pivot view, as shown in the screenshot below, which helps you to have an analytical view.
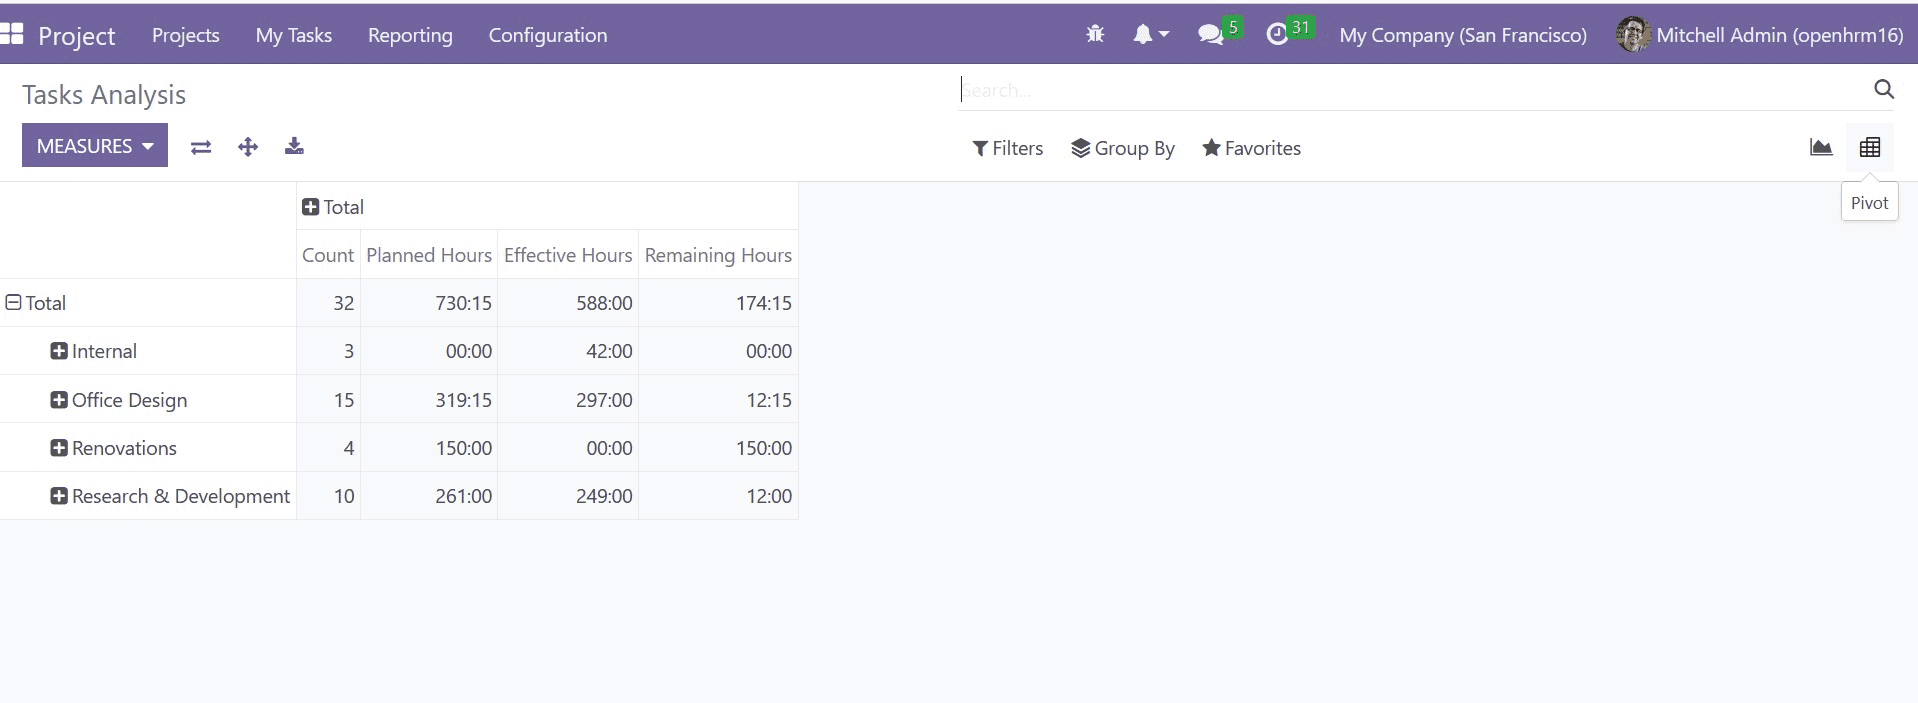
On the pivot view, you can analyze the count, planned, effective, and remaining hours. Under the graphical view, you can see the line, bar, and pie chart views as well. The INSERT IN SPREADSHEET option can be used to select a spreadsheet to insert the graph. On selecting the option, you will get a page, as shown in the image below.
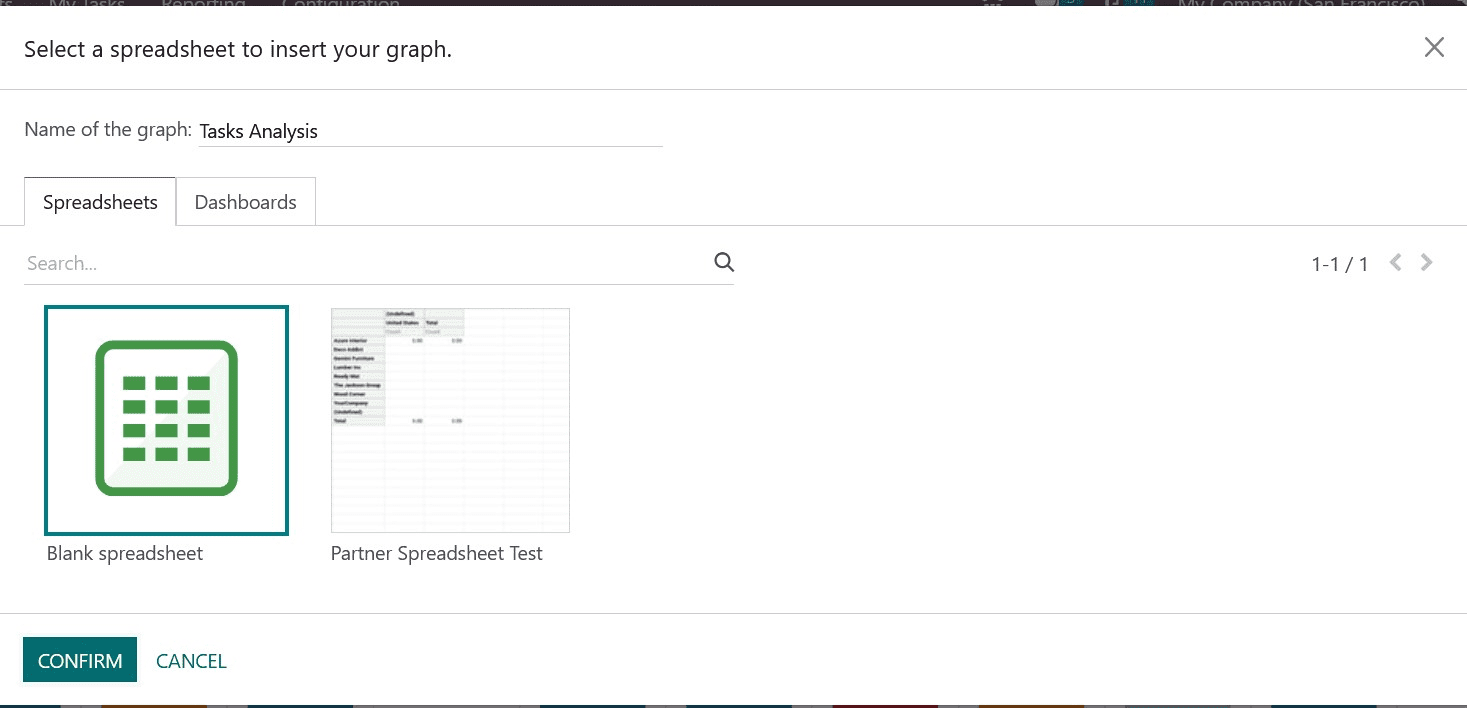
Here, you can provide the name of the graph as task analysis. Now, you can select the spreadsheet and then go to the CONFIRM icon. In the pivot view, you have the options, such as flip axis, expand all, and download xlsx, as in the image below.
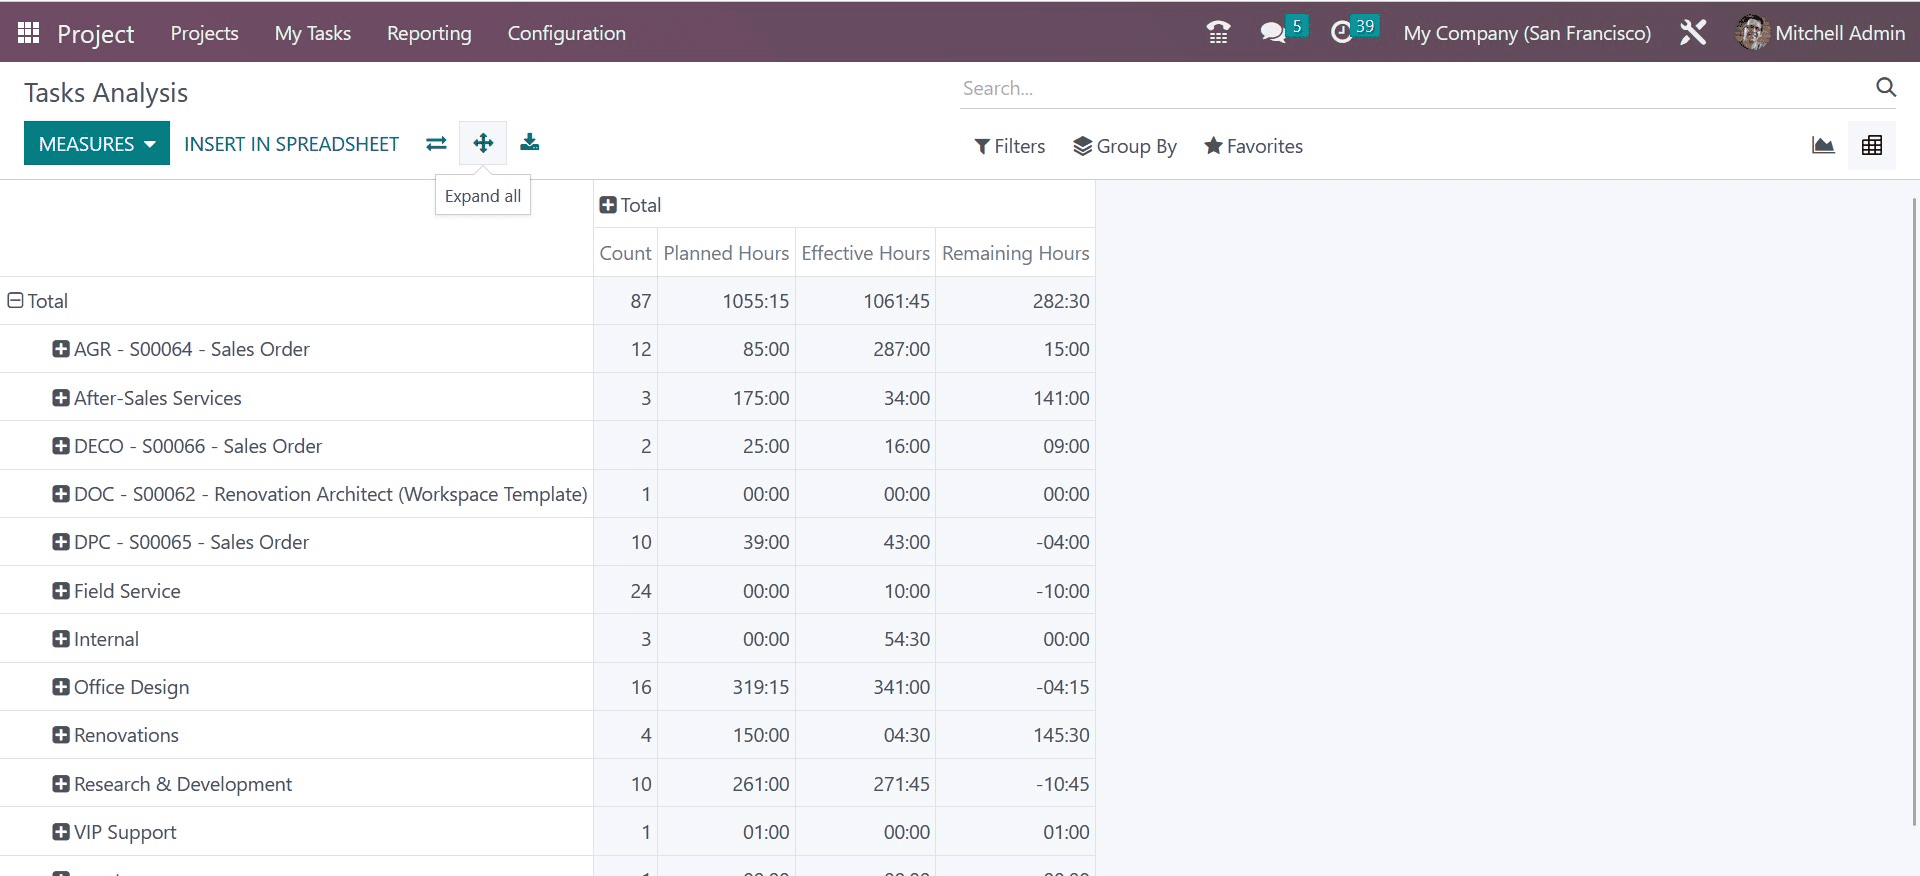
The options can be used to flip the axis, expand them, and then download the file as well.
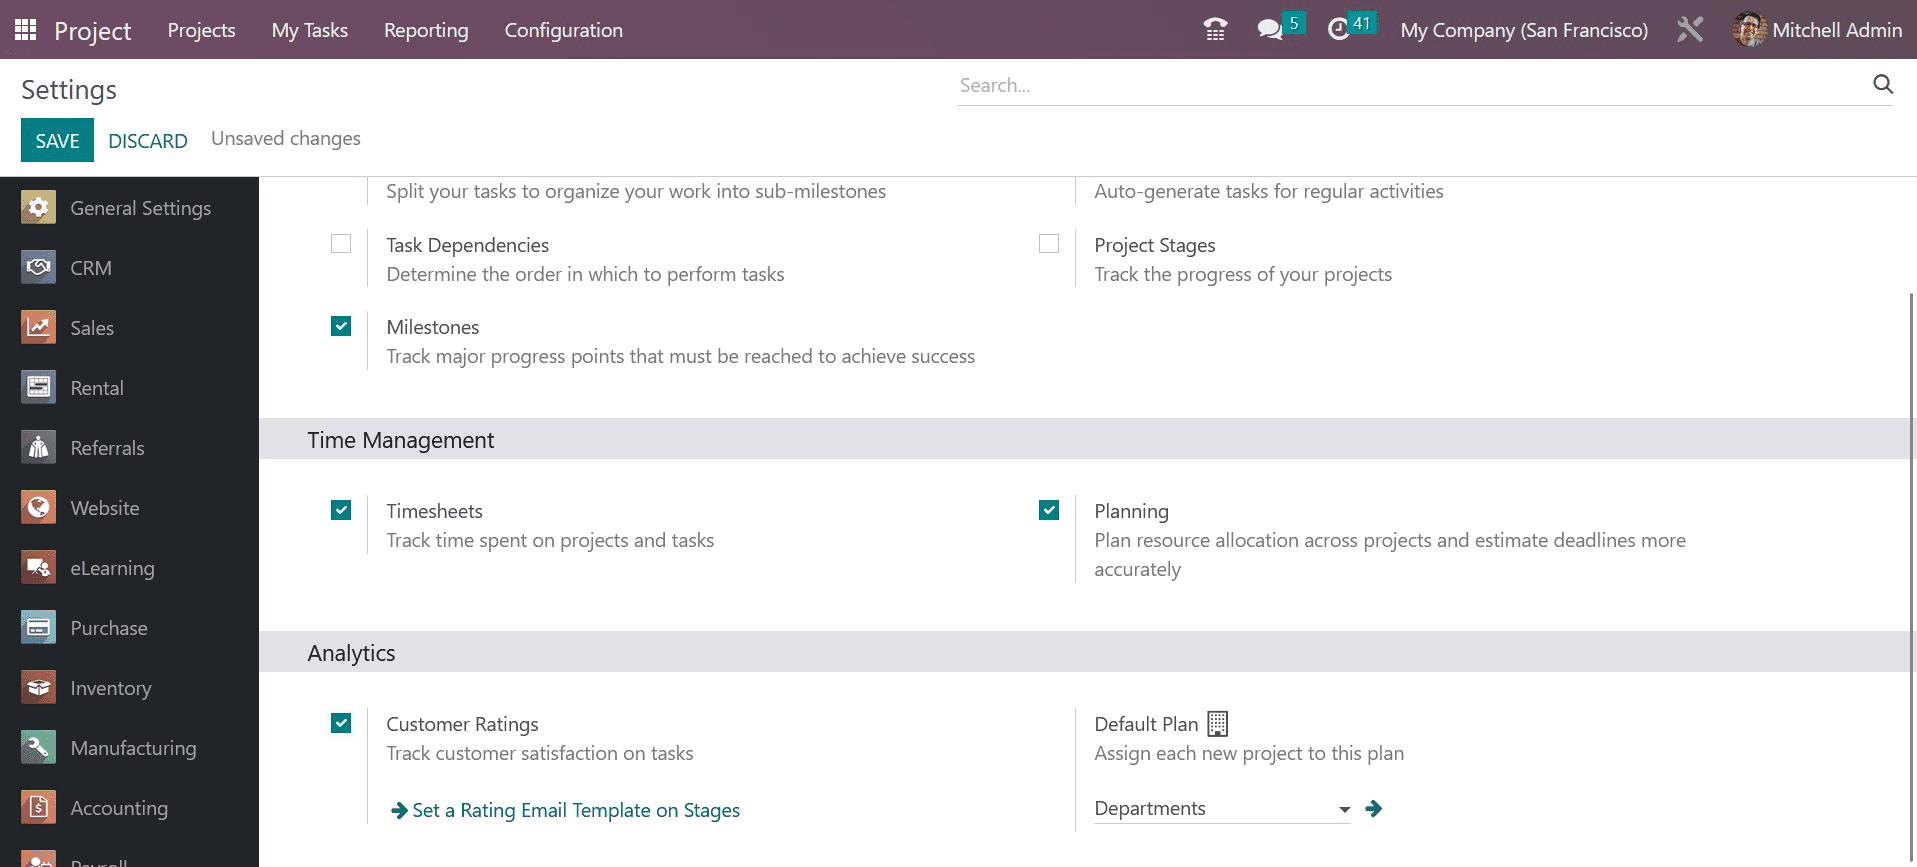
On enabling the corresponding option of Customer Rating from the Settings menu, the Customer Rating option will appear in the Reporting menu. On enabling the option, you will get the page of customer ratings. It will monitor task-related client satisfaction.

And this is all about reporting in the project management module. Altogether, the reporting option in every module is really a great assistance in the improvement of the company’s growth.
To read more about manage reporting in the Odoo 16 project management app, refer to our blog How to Manage Reporting in the Odoo 16 Project Management App