The Odoo CRM module will give users a thorough overview of all functional components of the Customer Relationship Management activities with Odoo CRM. With a thorough understanding of the CRM, you can access Leads, Opportunities, and Expected, and Total Revenue. There are two ways that the Dashboard can be viewed: one for administrators and the other for users. The CRM Dashboard will give the admin a complete understanding of the CRM's operations and give them a thorough knowledge of operations. On the other hand, the user will only get access to the details to which they have given permission.
Depending on the user's work function, the authorization varies. For instance, a salesperson will have a dashboard that is different from a sales manager's. Additionally, we may display various report kinds as graphs based on the values and CRM operations. It gives the reader a thorough understanding of the CRM operations of the business as they are being conducted in real time. You can see an overview of the CRM module's operation using the Odoo 16 CRM Dashboard module.
In this blog, let’s discuss the Odoo 16 CRM dashboard.
Features of Odoo 16 CRM Dashboard
Let’s look at the main features of the Odoo 16 CRM dashboard now.
* Dedicated Views for Administrators and Users.
* Activity tracking
* Year-to-date bar chart
* User Settings' Target Field
* Goals for monthly revenue and top deals.
* Depending on the users' degree of employment, they will each have a different set of permissions.
* Information about recent and upcoming activities.
* Opportunity control of lost reasons.
* Dashboard Cards with buttons.
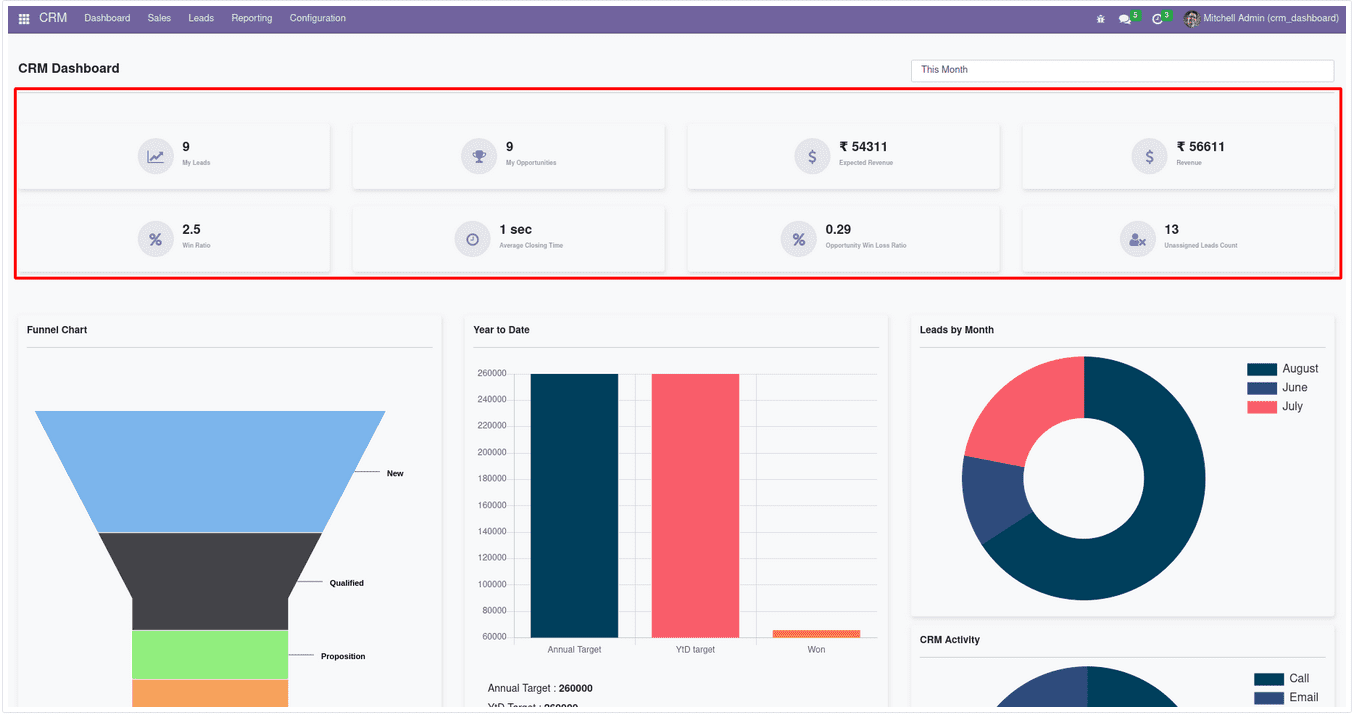
Visit the CRM module and choose the dashboard menu. Users can access that information and particular Odoo CRM procedures by clicking on the pertinent Cards.
These Clickable Cards will also serve as a navigation symbol on the CRM dashboard to simplify operations. Additionally, these Clickable Cards will guarantee that the CRM dashboard's configuration and functionality are as required.
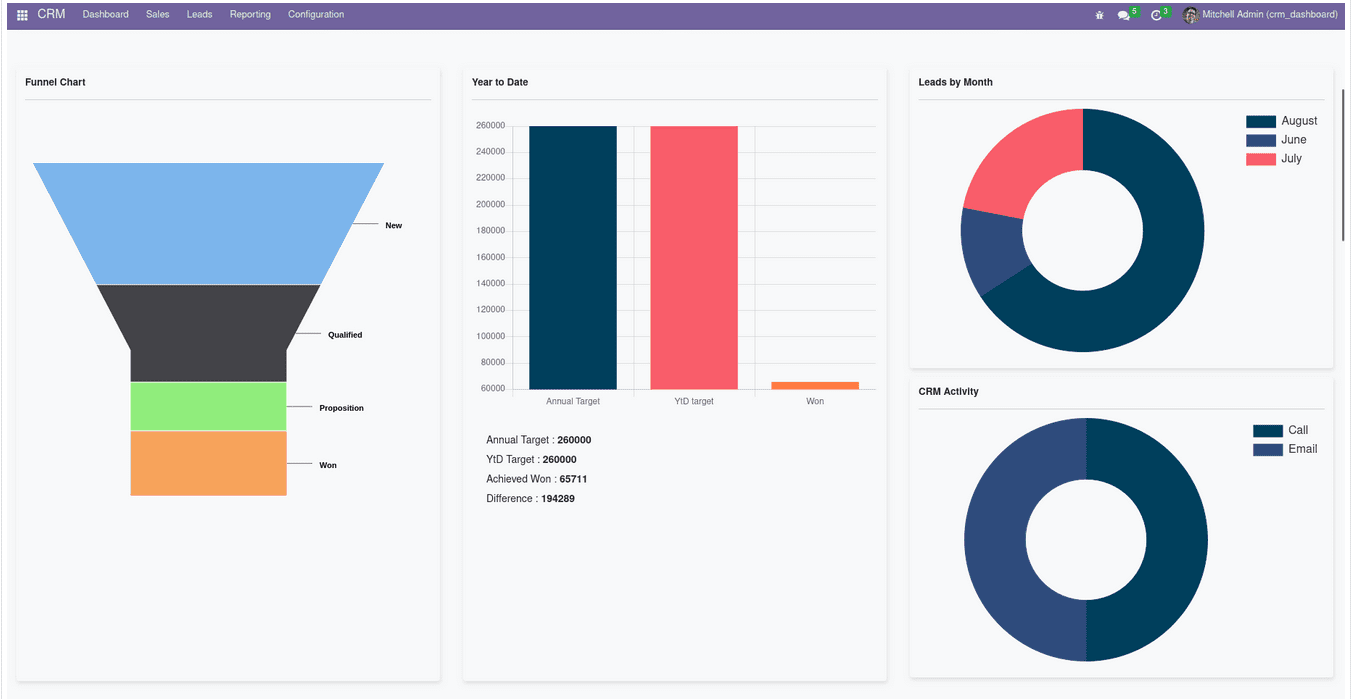
You can get thorough visibility into active Leads with a dedicated Funnel Chart. The leading characters will be New, Qualified, Proposal, and Won. Additionally, the Year date target will shed light on the accomplished objectives. The Donut graph will give a clear view of the monthly Lead operations based on the Lead operation. The activity analysis on the leads will also be shown in the Activity Donut graph.
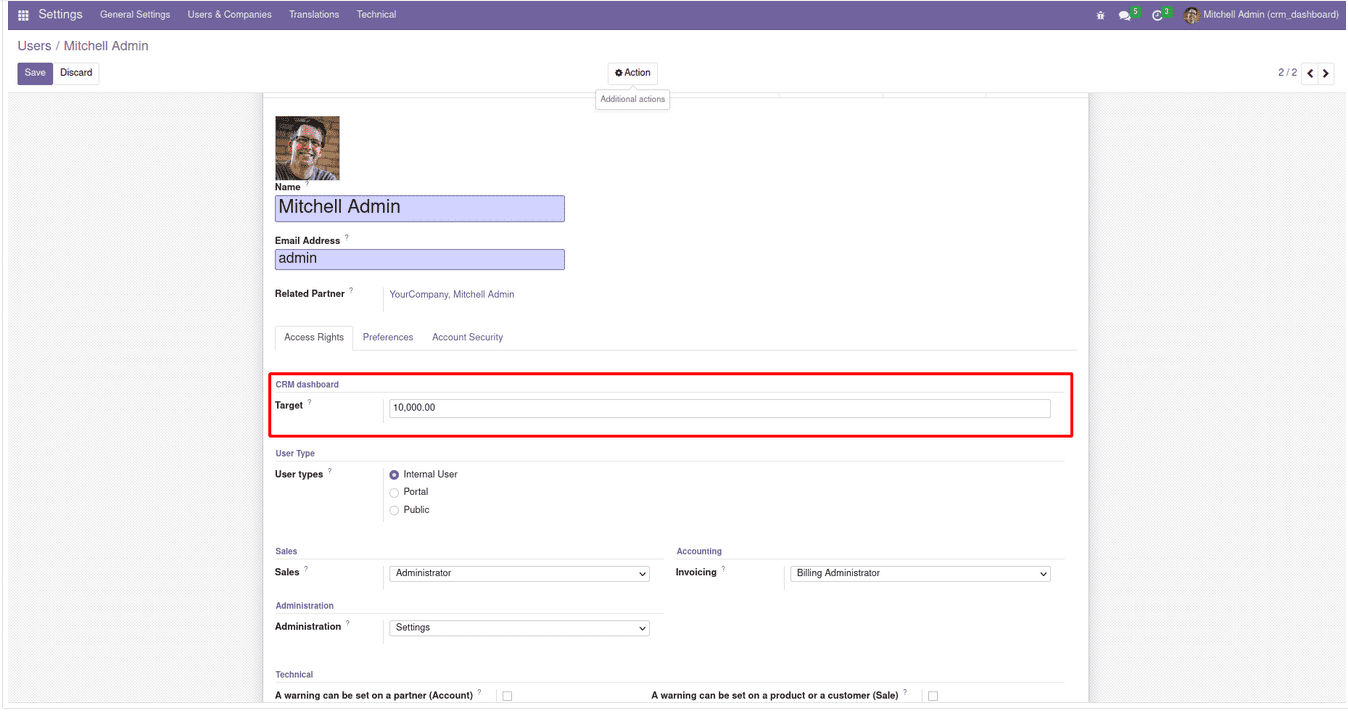
Using the CRM Dashboard setup, you can specify a user's target number for Leads they need to acquire over a Date, Month, or Year. The Settings tab > User Settings > Below the Access Right tab is where the Targets are specified.
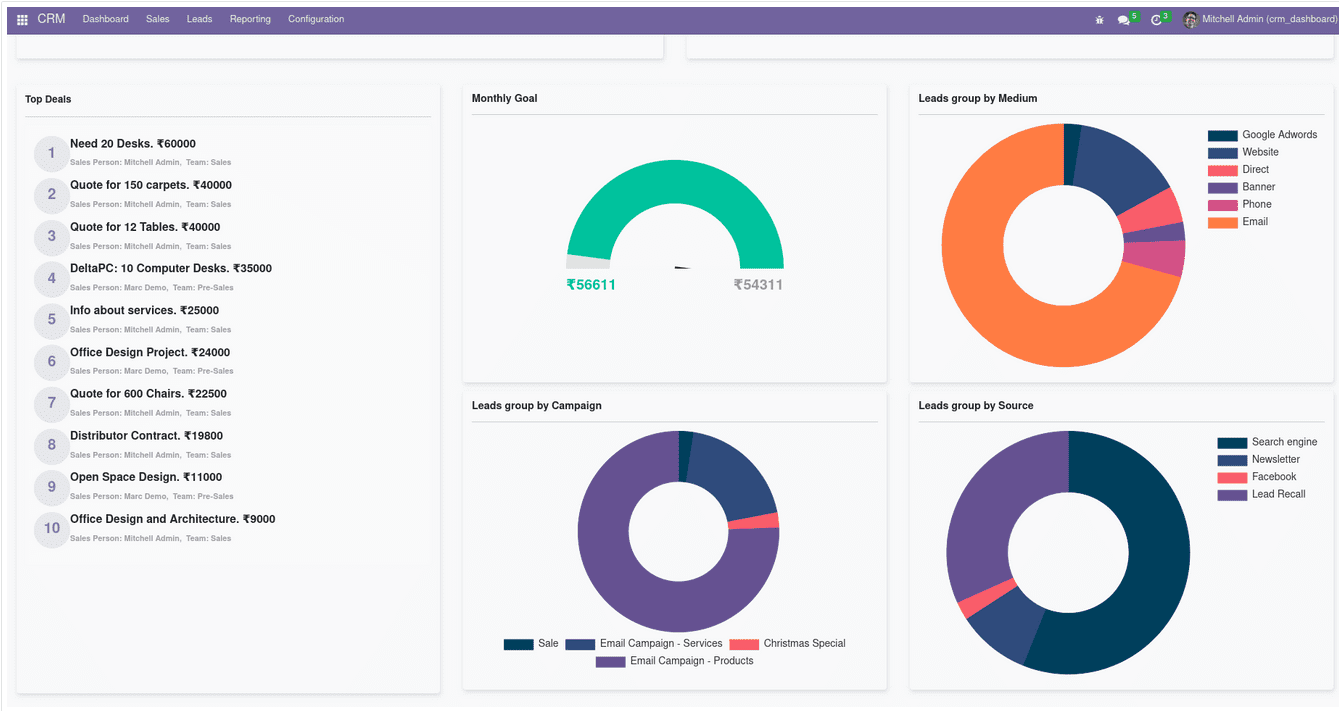
To help users or salespeople manage leads and associated opportunities, the Best Deals on the products and services will be provided in a dedicated menu. Additionally, this will be a helpful tool for rapidly advertising the different deals to the Leads and Opportunities.
The Monthly Goal Gauges, which are provided, will encourage users and the sales staff to pursue more leads in order to meet the goal. The firm will also benefit from the Lead Groping analysis using the graph in the shape of a donut, which analyzes Lead Groups by Medium, Campaign, and Source.
For CRM operations, activity management is essential, and the CRM Dashboard will have a dedicated tab listing the scheduled activities. Each user will have a separate set of tabs depending on how they operate within the firm. Additionally, admins get a different picture of their own actions and a deeper understanding of the operations. Additionally, a graph displaying the Total Revenue of the relevant Salesperson will be provided. It provides a thorough understanding of the Revenue from the generated Leads.
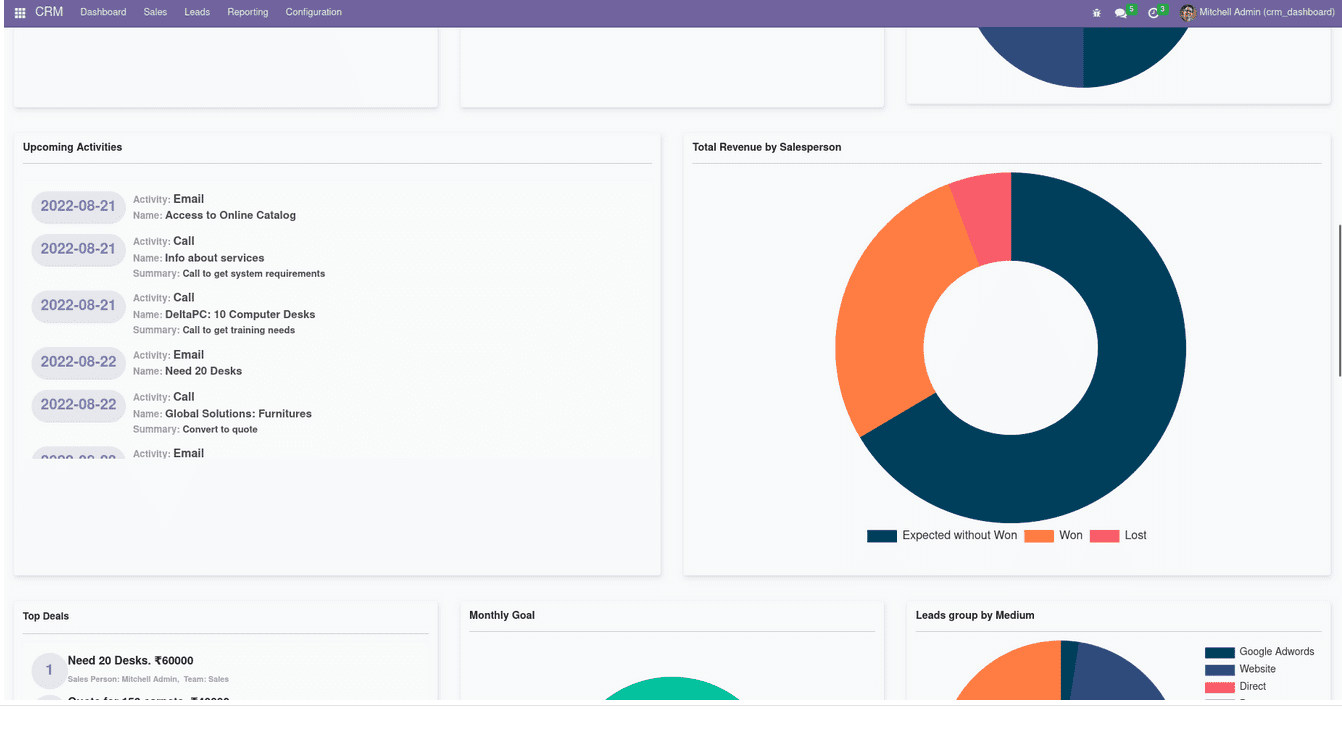
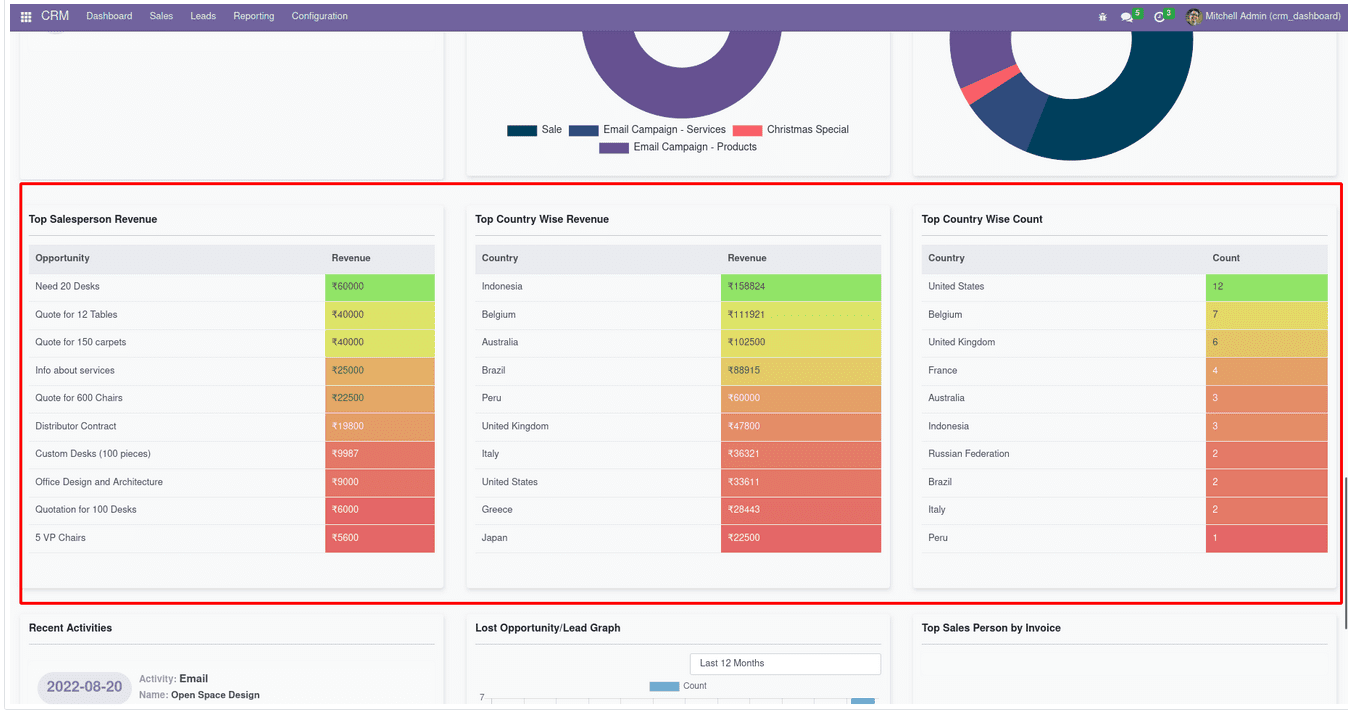
In the CRM Dashboard, you may access a helpful heat map on the components of the Revenue derived based on CRM operations. Here, a color-coordinated heat map will be used to show the Top Salesperson and the Top Country Revenues. This gives clear insight into the monetary values of the implemented revenue. Additionally, a thorough tab will provide information on the country-by-country count of opportunities. On a heat map, the Country-wise count is also shown.
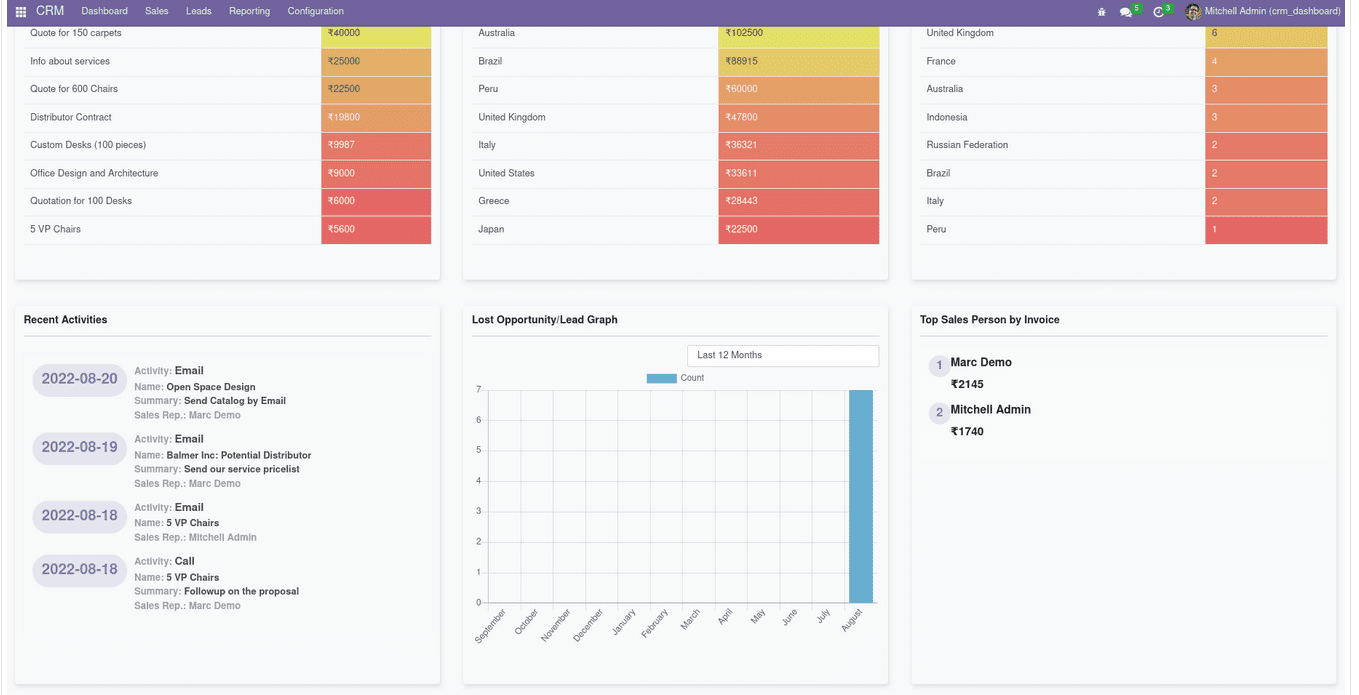
Depending on the year or month, the Lost Analysis Graph offers a more exact understanding. It will give you information on missed opportunities and leads. The description tab for Recent Activities will provide you with a thorough understanding of the Activities that have been planned and carried out recently concerning Customer Relationship Management operations in the pursuit of Leads and Opportunities.
Access to the CRM Dashboard is given to Admin and User. Each contains its own perspectives and is established already. The screenshot that follows displays the CRM Dashboard as seen by the user. In this case, the operations that the specific user is authorized to change will be presented with their information.
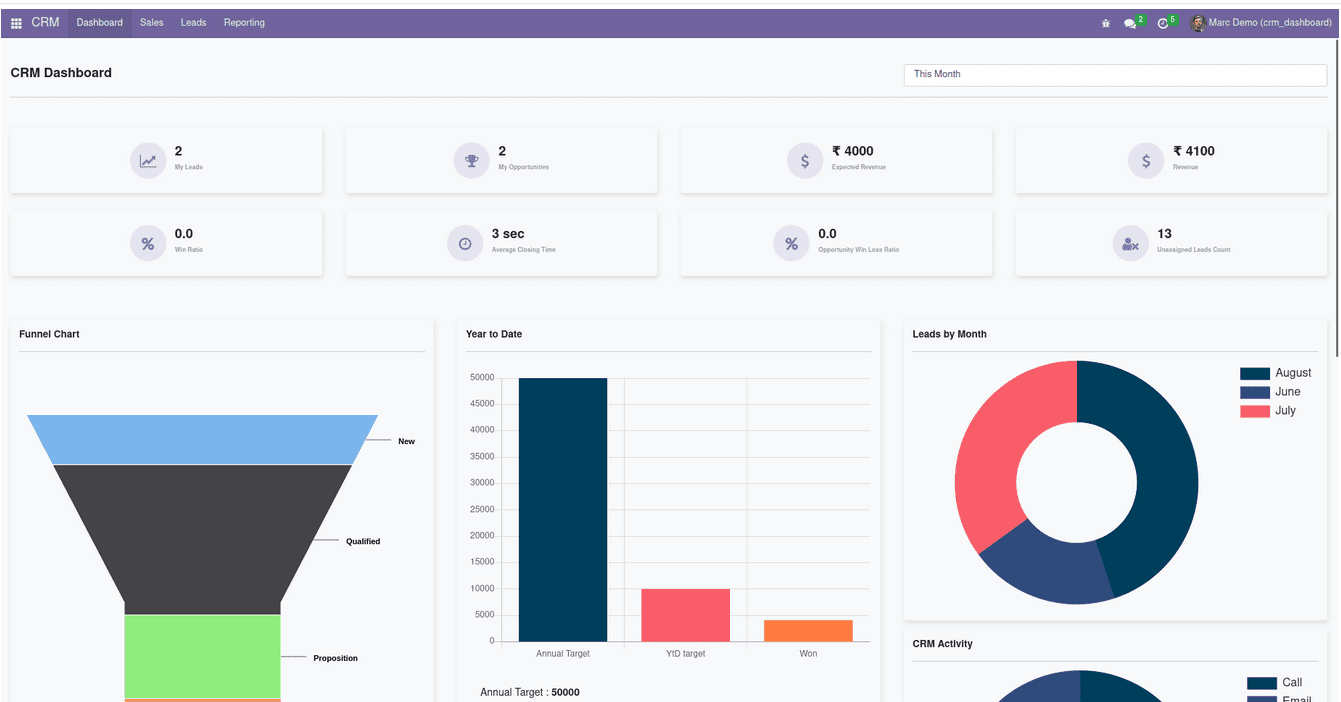
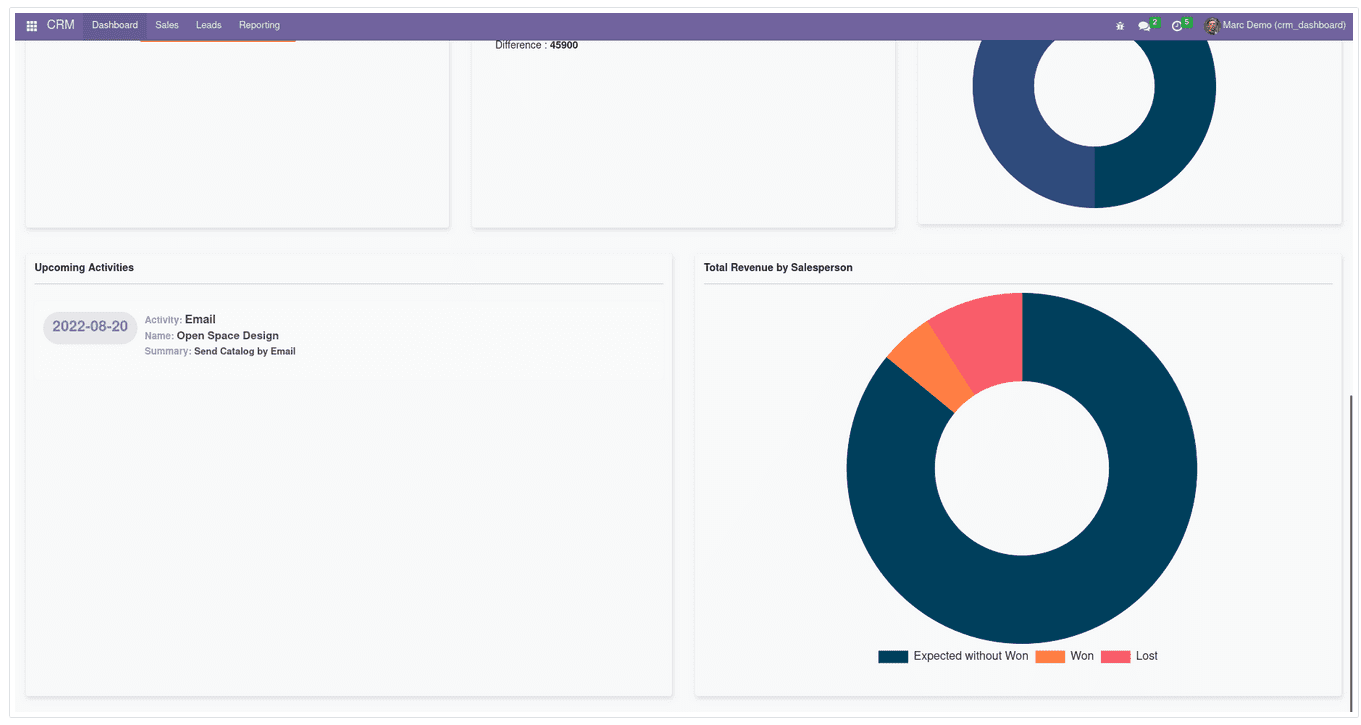
Users can evaluate leads by month and other activities within the Odoo 16 CRM dashboard. Analyzing each report makes it possible to make further improvements in a business. You can boost your company workflow once imparting Odoo 16 CRM module.