Odoo Software helps its users with a wide variety of features that help the growth of sales and production and, thereby, the growth of the company on a global level. Its user-friendly nature with lots of modules in it makes the process easy to work through. One of the notable modules in this Odoo software is the CRM Module which has got a unique feature of reporting that helps to get a detailed analysis of the working of the procedures in the production processes. Odoo ERP Software provides you with a unique feature of Reporting in the CRM Module that provides us with an overall analysis of the processing of the module. With the help of this feature, you can easily get the CRM operations that happen on a daily, monthly, and yearly basis. This feature thereby helps to improve the quality of work if required in order to increase the production of the company. Wherever improvements are required, you can easily get details about it here. Odoo has reporting feature for
* Dashboard
* Forecast
* Pipeline
* Leads
* Activities
* Partnership
* Lead Generation Views
Let's look at the functioning of Reporting in each of these cases.
Dashboard
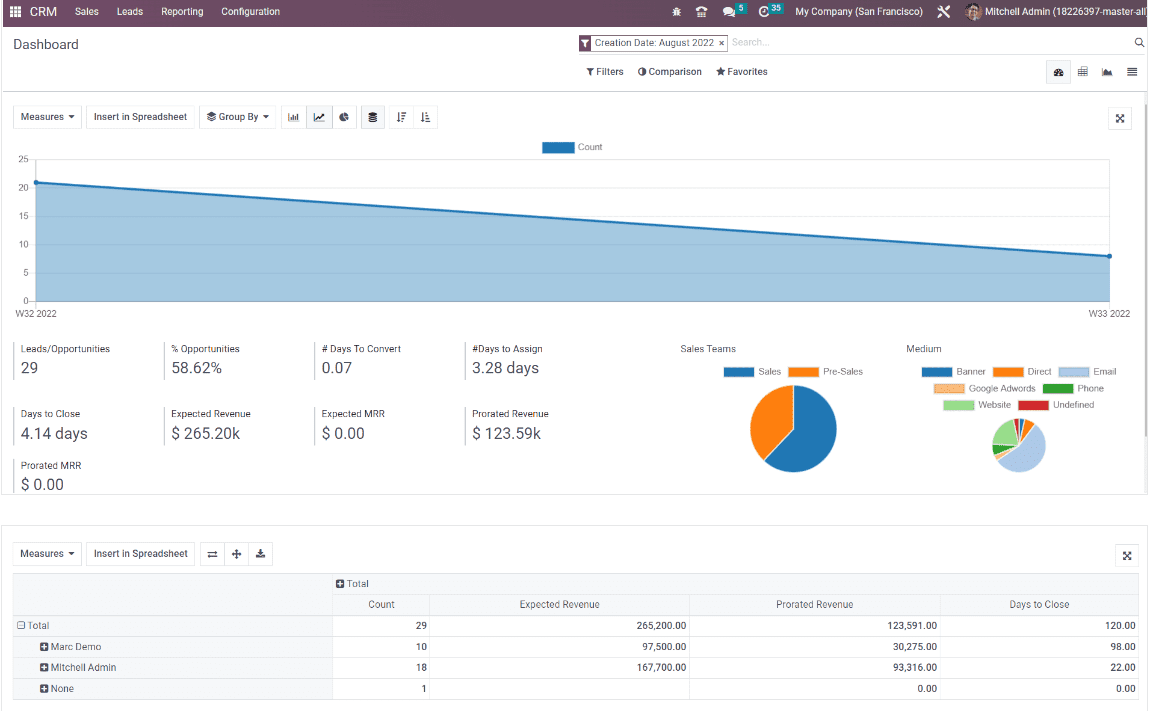
The reporting of the dashboard comprises the reporting of complete operations in the CRM. Within a single window, you will be able to see the complete operations of the module. Here the reports will be in the form of either graphical or in the form of pivot tables. Using the option given in the top right corner of the page, you can easily change the form of a report into a pivot view, graphical view, or list view. The report can also be viewed in full view with the help of the show full-screen option, which is provided on the top right corner of the page. Graphical representation consists of a number of types like Pie charts, Line charts, and Bar charts, respectively. The screen gives the data of the total number of leads or opportunities, percent opportunities, number of days to convert, number of days to assign, days to close, expected revenue, expected MRP, prorated revenue, and prorate MRP, respectively. In the line chart, you can easily understand the pie diagram of the sales team and the medium of lead formation. Moreover, line charts and bar charts can be formed in ascending order and descending order as well.
Depending on particular measures available in the Reporting platform, pivot tables and graphs can be created.
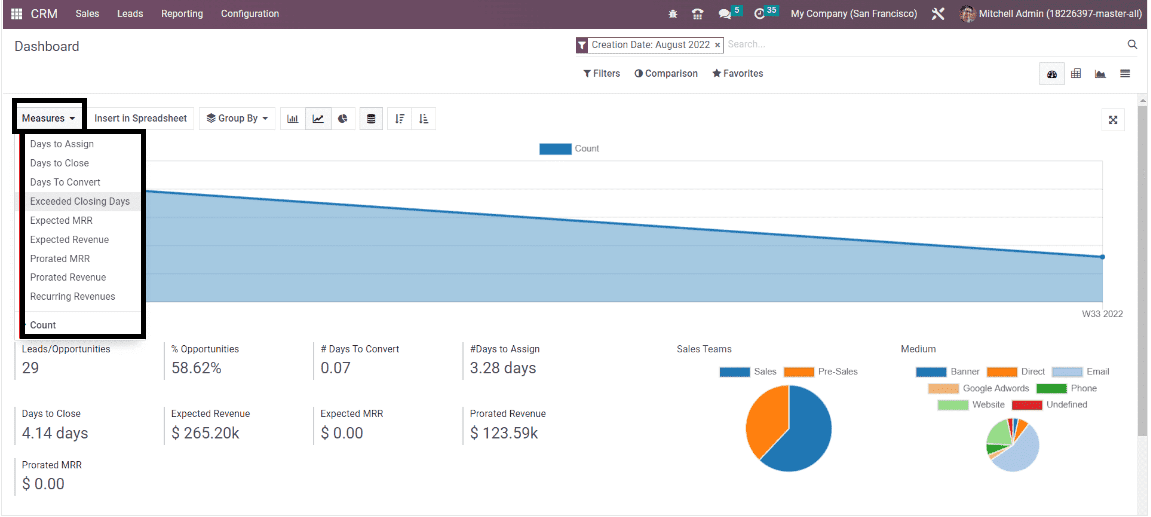
The given image showcases the option to select required measures from the provided options like Days to assign, Days to close, Days to convert, Exceeded closing days, Expected MRP, Expected Revenue, Protracted revenue, protracted MRP, Recurring revenue, and Count, respectively. A Suitable report will be displayed on the screen according to the measure that we select. You can also make use of the sorting tools that are customizable in order to enhance the reporting in the CRM Module.
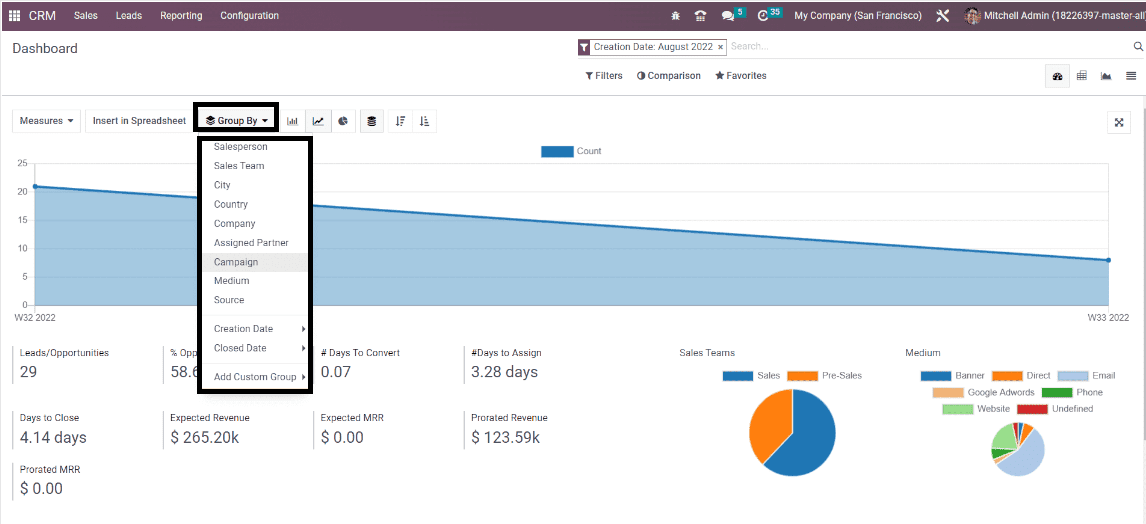
Here under the Group By option, you are provided with various sorting tools that help you with sorting options for grouping the given data depending on the Salesperson, Sales Team, City, Country, Company, Assigned Partner, Campaign, Medium, Source, Creation Date, and Closed Date respectively. With the help of the Add Custom Group option, you can build a new group option according to your needs.
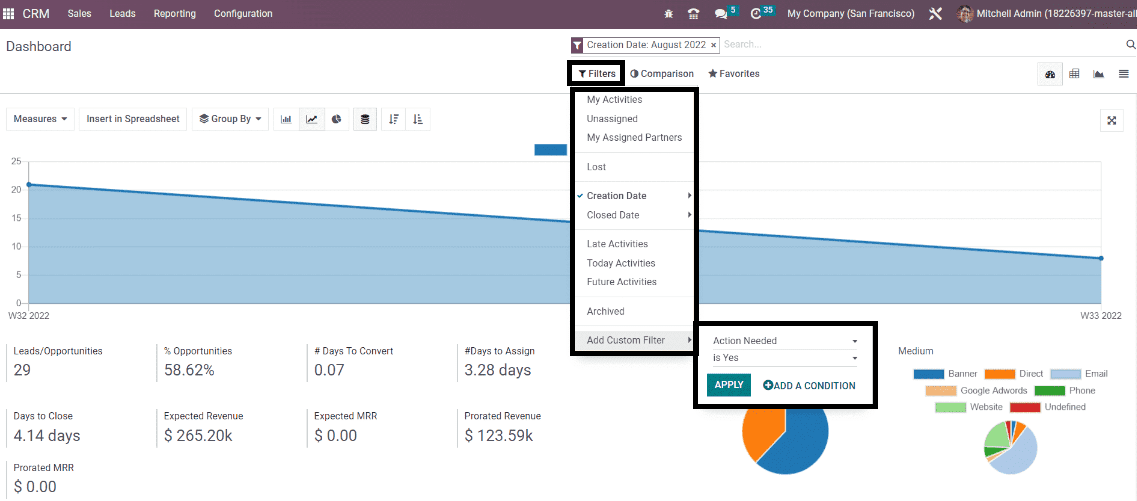
Here you can easily clarify the data depending upon the various options provided, such as My Activities, Unassigned, My Assigned Partners, Lost, Creation date, Closed Date, Late activities, Today activities, Future activities, and finally, the Archived filters. With the help of the Add Custom Filters, you are able to make changes to the necessary filters.
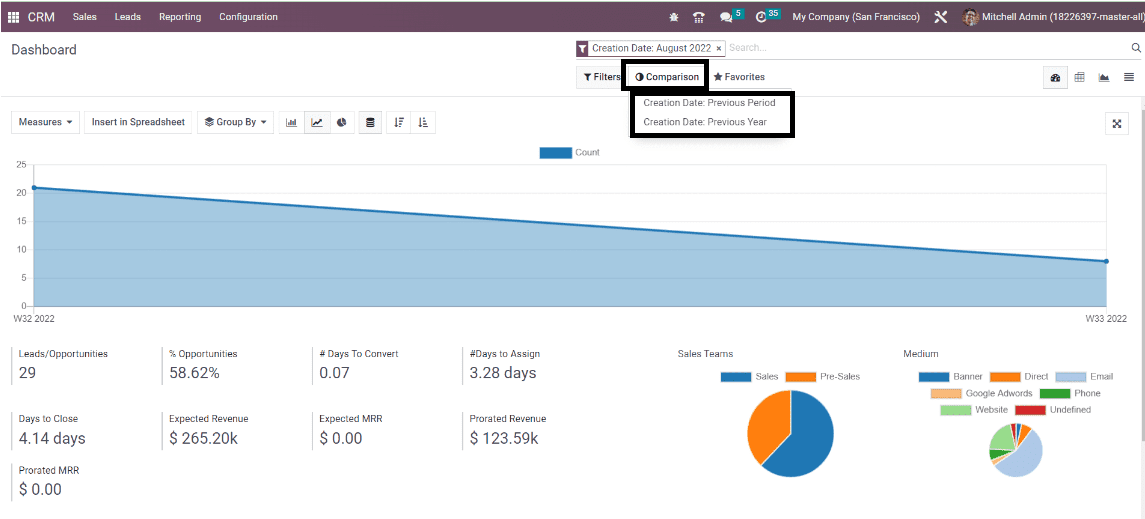
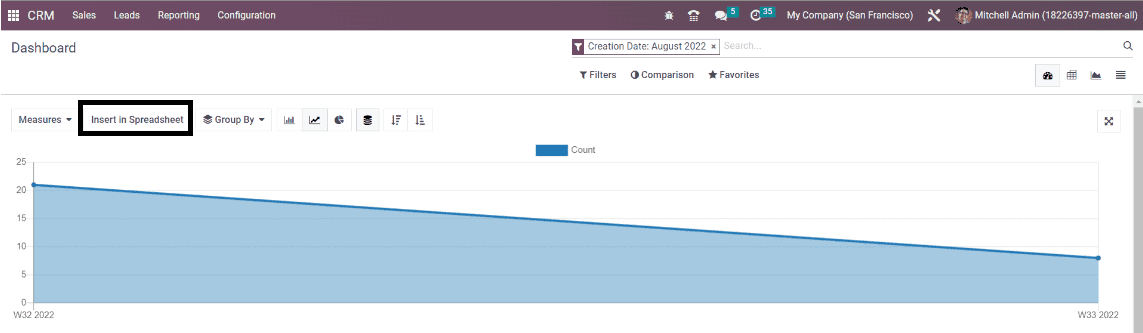
The next unique feature of the dashboard is the Comparison tool. With this feature, you can easily compare the existing data with the previously created data. With the help of the Insert in Spreadsheet option, you can easily add a graphical or pivot table to the spreadsheet.
On selecting this option, you will get a pop-up window for choosing the spreadsheet in order to add a pivot table or graph.
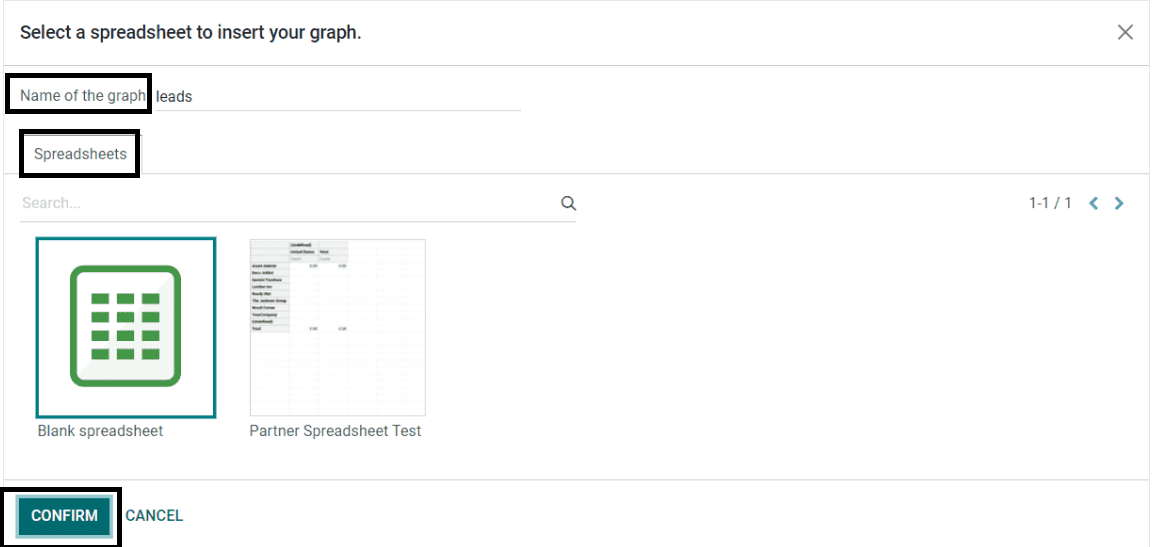
Here you can give a graph or table title in the Name of the graph field. And then, click on a particular spreadsheet under the Spreadsheets tab. Then, go for the CONFIRM button that will form a spreadsheet of your documents with the information that is available in graphs or tables.
Forecast
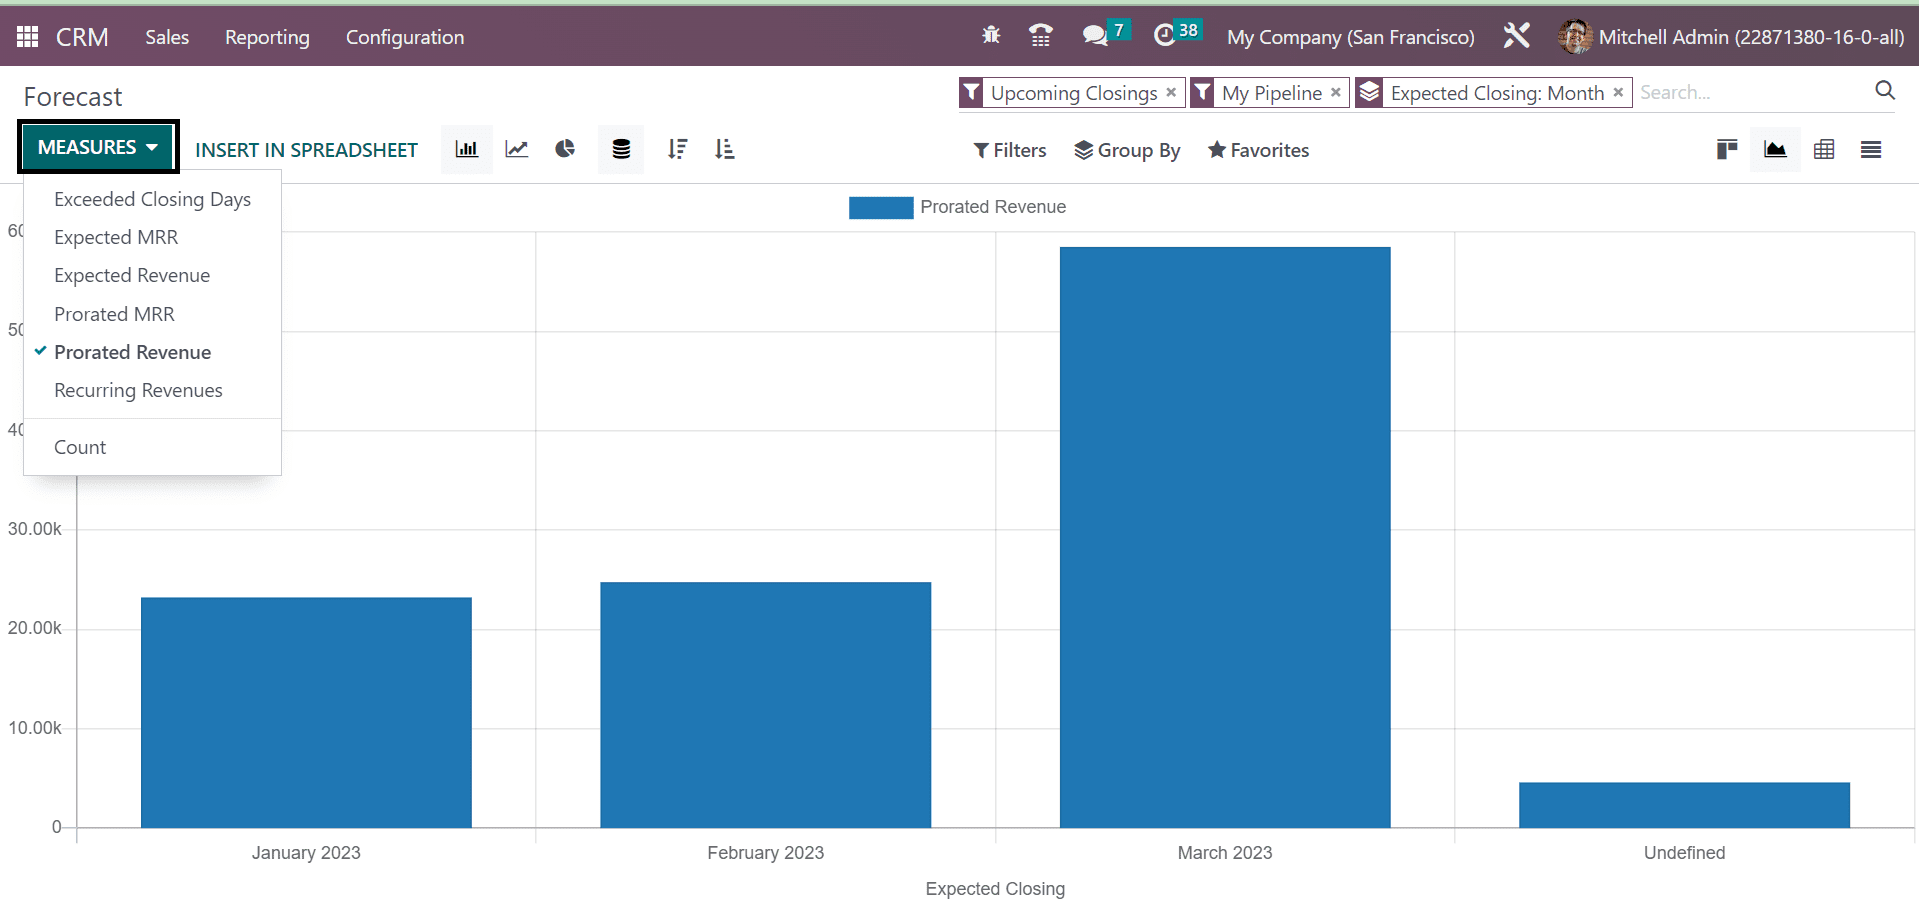
The reports of future revenues will be available to analyze using the forecast option in reporting. In the below graph of the forecast, you will get the expected closing rates mentioned on the X-axis, and Y-axis showcases the Prorated revenue data. Here, you will get a MEASURES icon, where you can choose appropriate measures, such as Expected Revenue, Protracted Revenue, and many more.
This area is allowed to view in the form of Kanban, Pivot, Graph, or List view. By giving appropriate filters, groups, and measures, you can enhance the forecast reports in the CRM Module. In the kanban view, the forecast report for each month can be viewed as shown below.
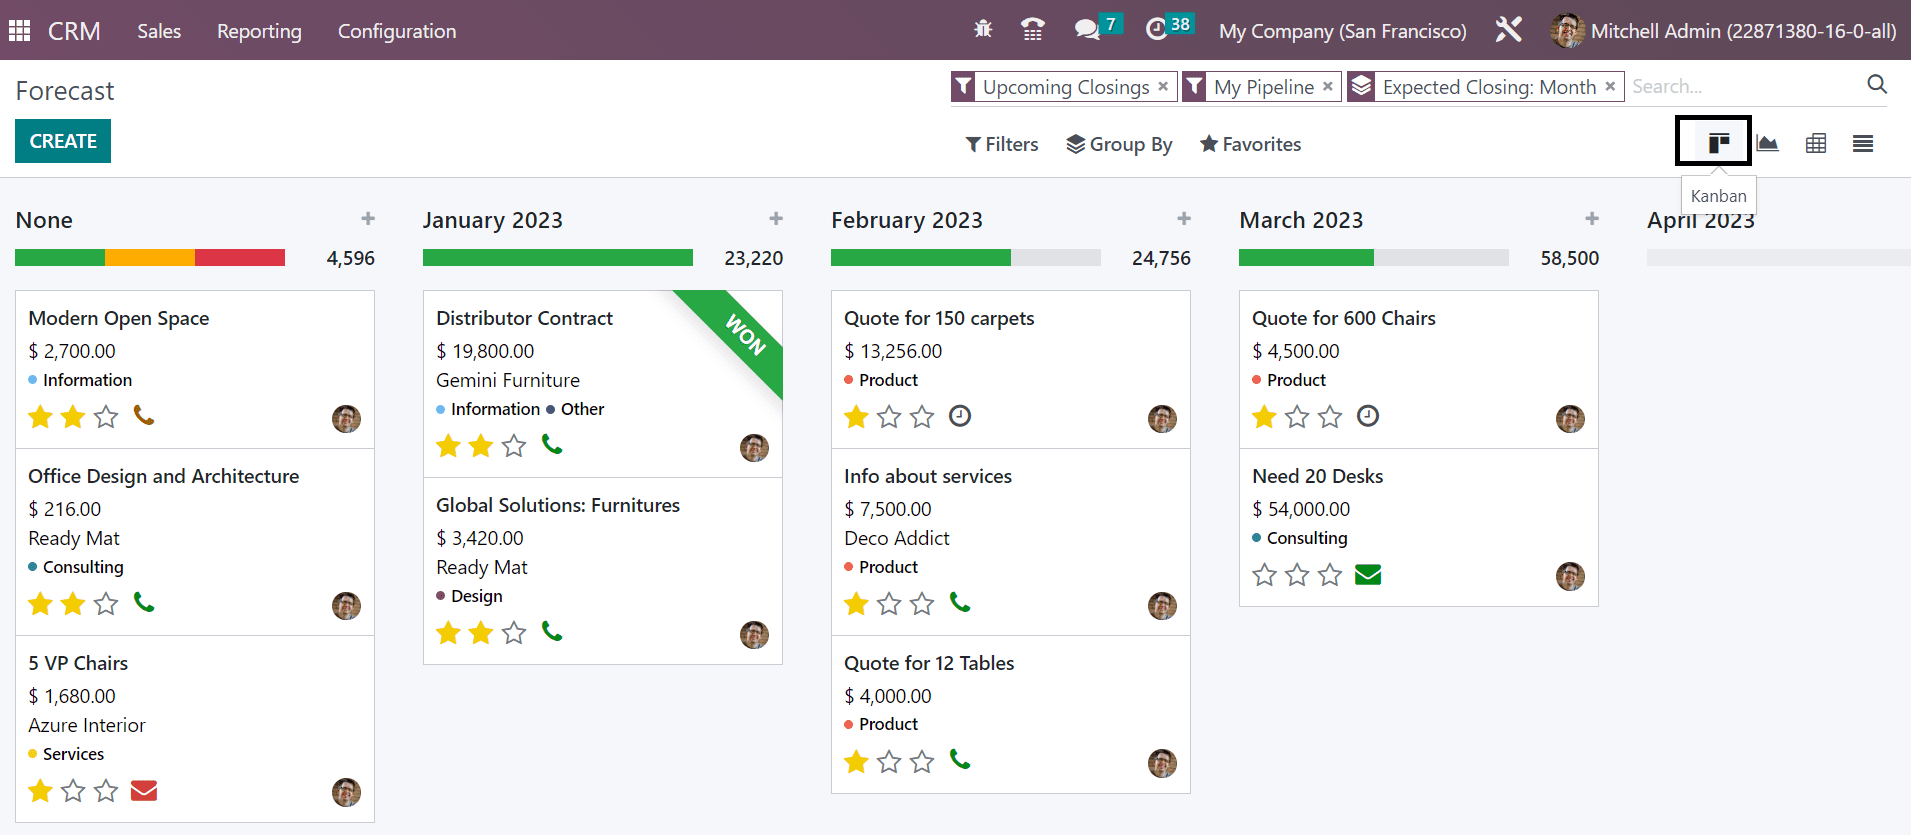
Here the prorated revenue can also be viewed.
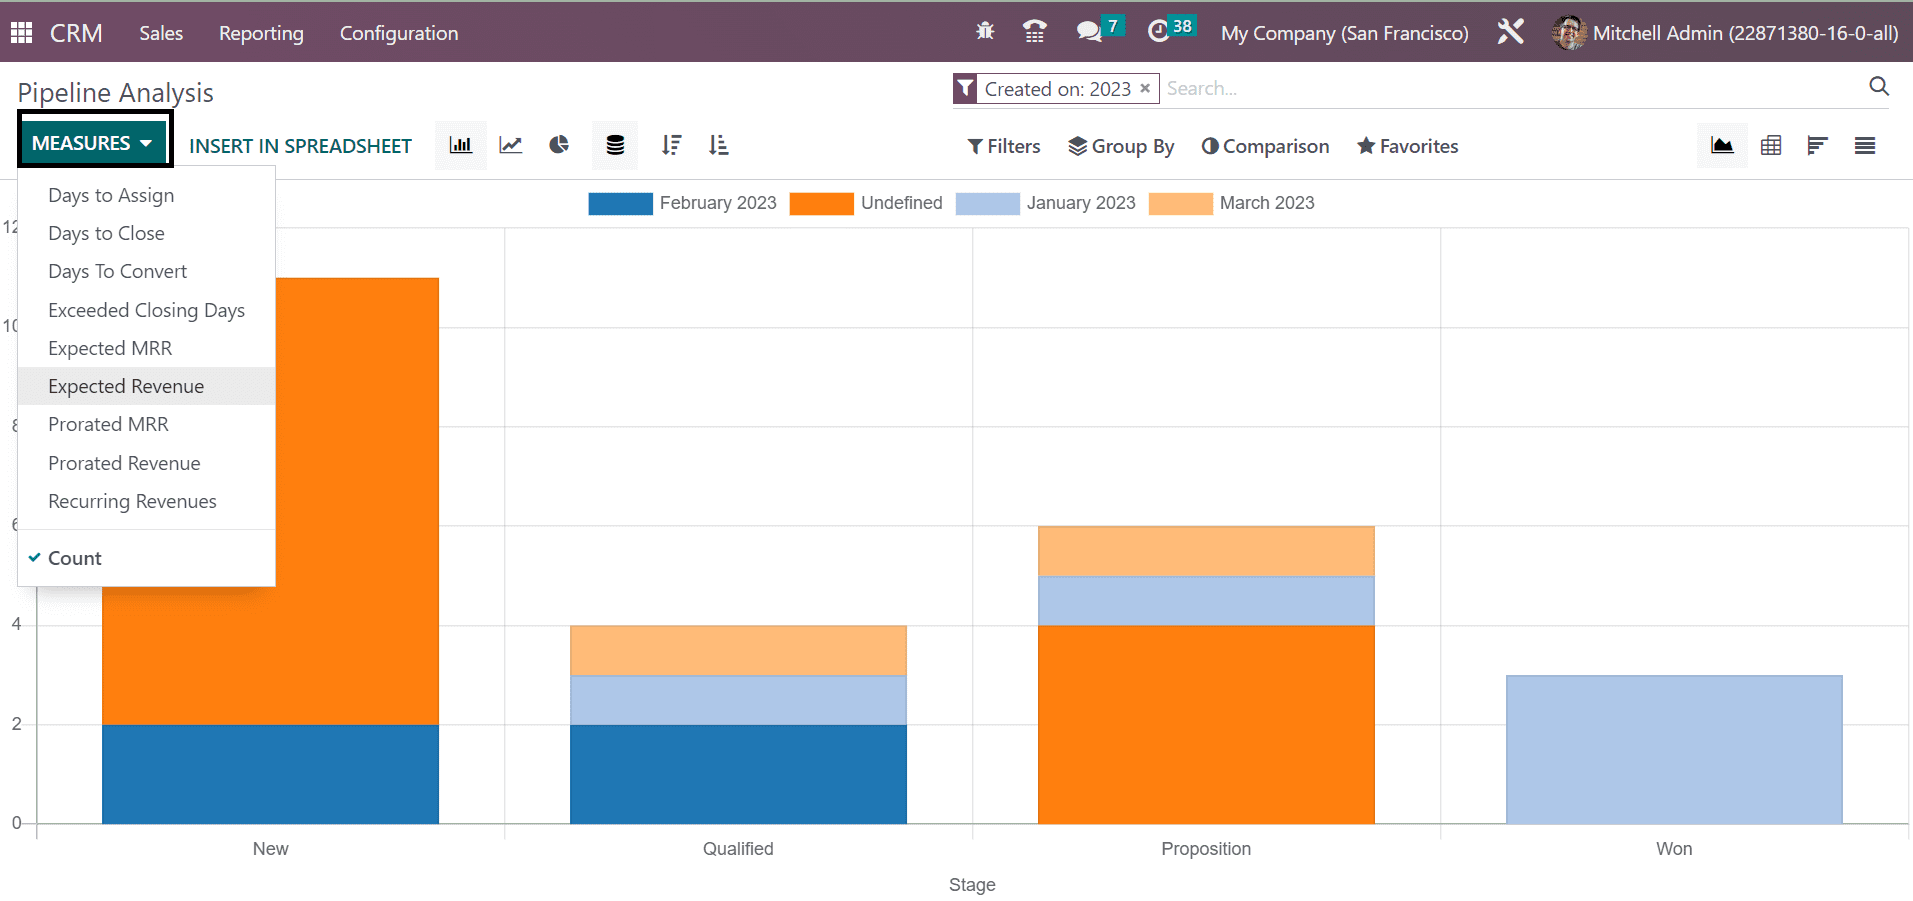
Pipeline Analysis
The details of all pipeline activities will be available in the Pipeline Analysis options, which are given in the reporting option. In the Pipeline Analysis, you will get the graphical view of the window, where you will get the information of the stage that is marked on the X-axis and the Count marked on the Y-axis. On the topmost corner of the graphical representation, you can see the count of each stage in a particular year. With the help of the MEASURES button, you can add different measures, such as Days to Close, Expected Revenue, Days to Assign, and many more, as shown below.
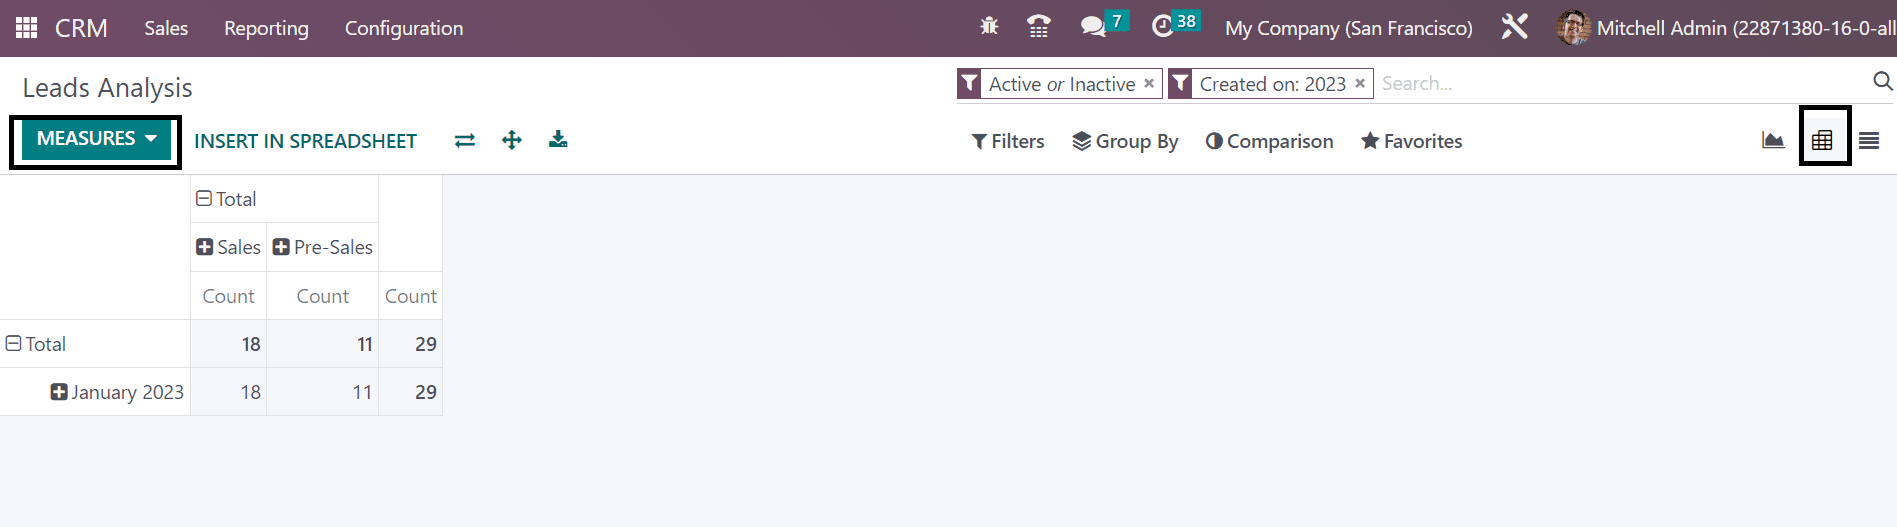
Lead Analysis
The reports of all the leads that are formed by various fields are able to be seen with the help of this leads analysis option in the reporting feature of the CRM Module. With this unique feature of the CRM, you can easily study the leads within the module and thereby enhance wherever improvement is required in the formation of lead operations. In the below image of the pivot view, the pivot table of the lead analysis window showcases the total counts of sales and pre-sales counts on a particular year. Using the MEASURES icon, as you can see in the screenshot, you can easily apply some other measures, such as Expected Revenue, Days to Close, and many more.
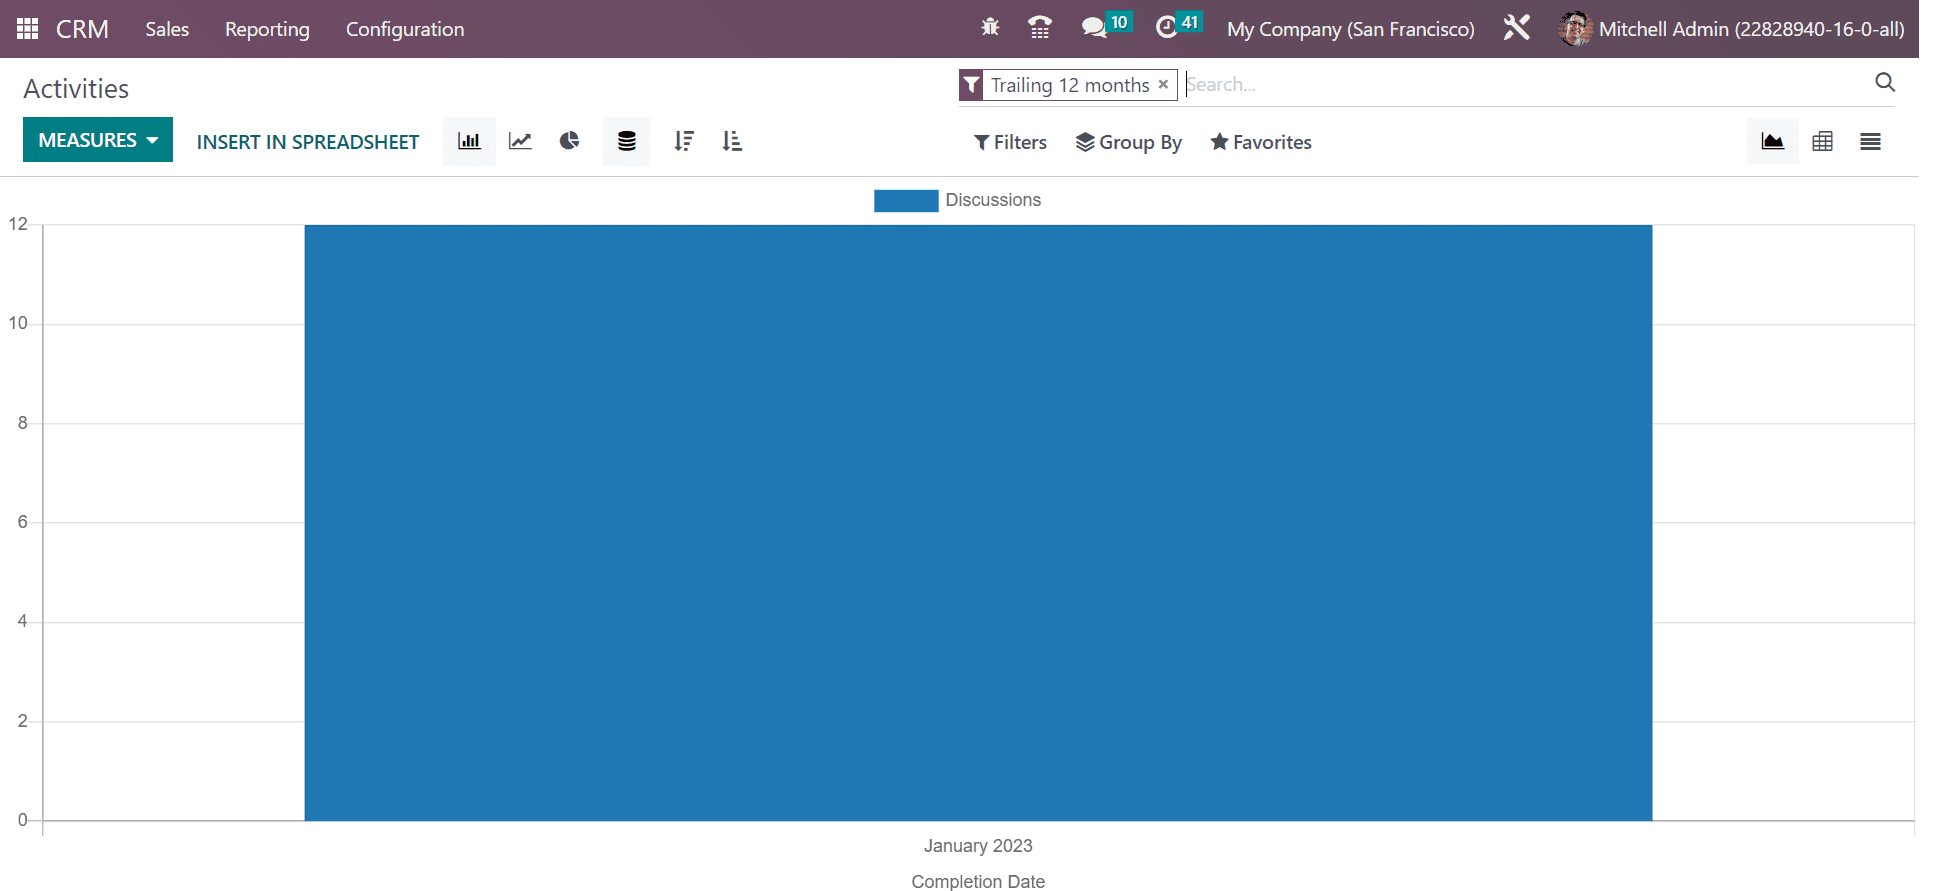
Activities
The reporting feature in the CRM Module helps you with another option of Activities with which you can gain all already scheduled and completed activities in the Odoo Software. In the below graph, you can see the discussion rate marked in blue color. Details regarding the activities, such as activity type, activity description, to whom the activity is assigned, company name, and so on, can be seen by clicking on the graph.
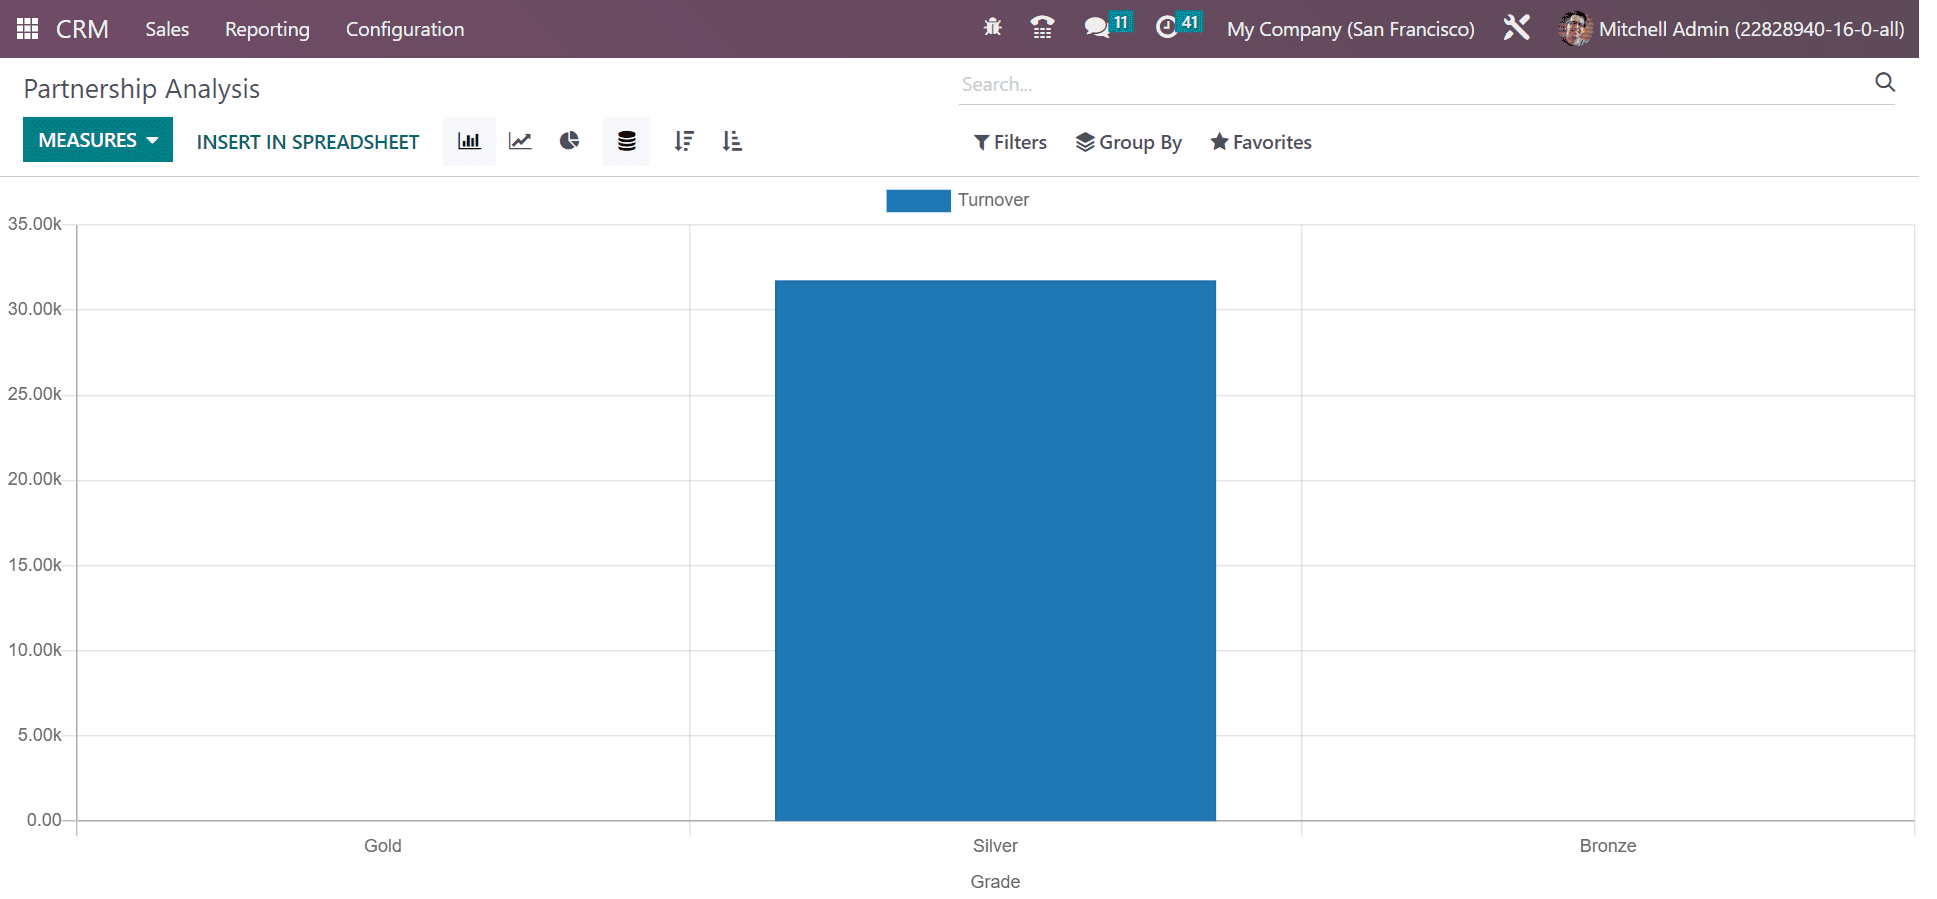
Partnerships
Reporting has a feature of Partnership Analysis with which you can easily showcase the graphical representation of turnovers in finance with the help of the partner. You can create reports of the opportunities that are formed using the partners along with the support from the Measures button.
Lead Generation Views
Under the Reporting Tab, you have got a Lead Generation View option under which you can even create a new lead Generation View as follows.
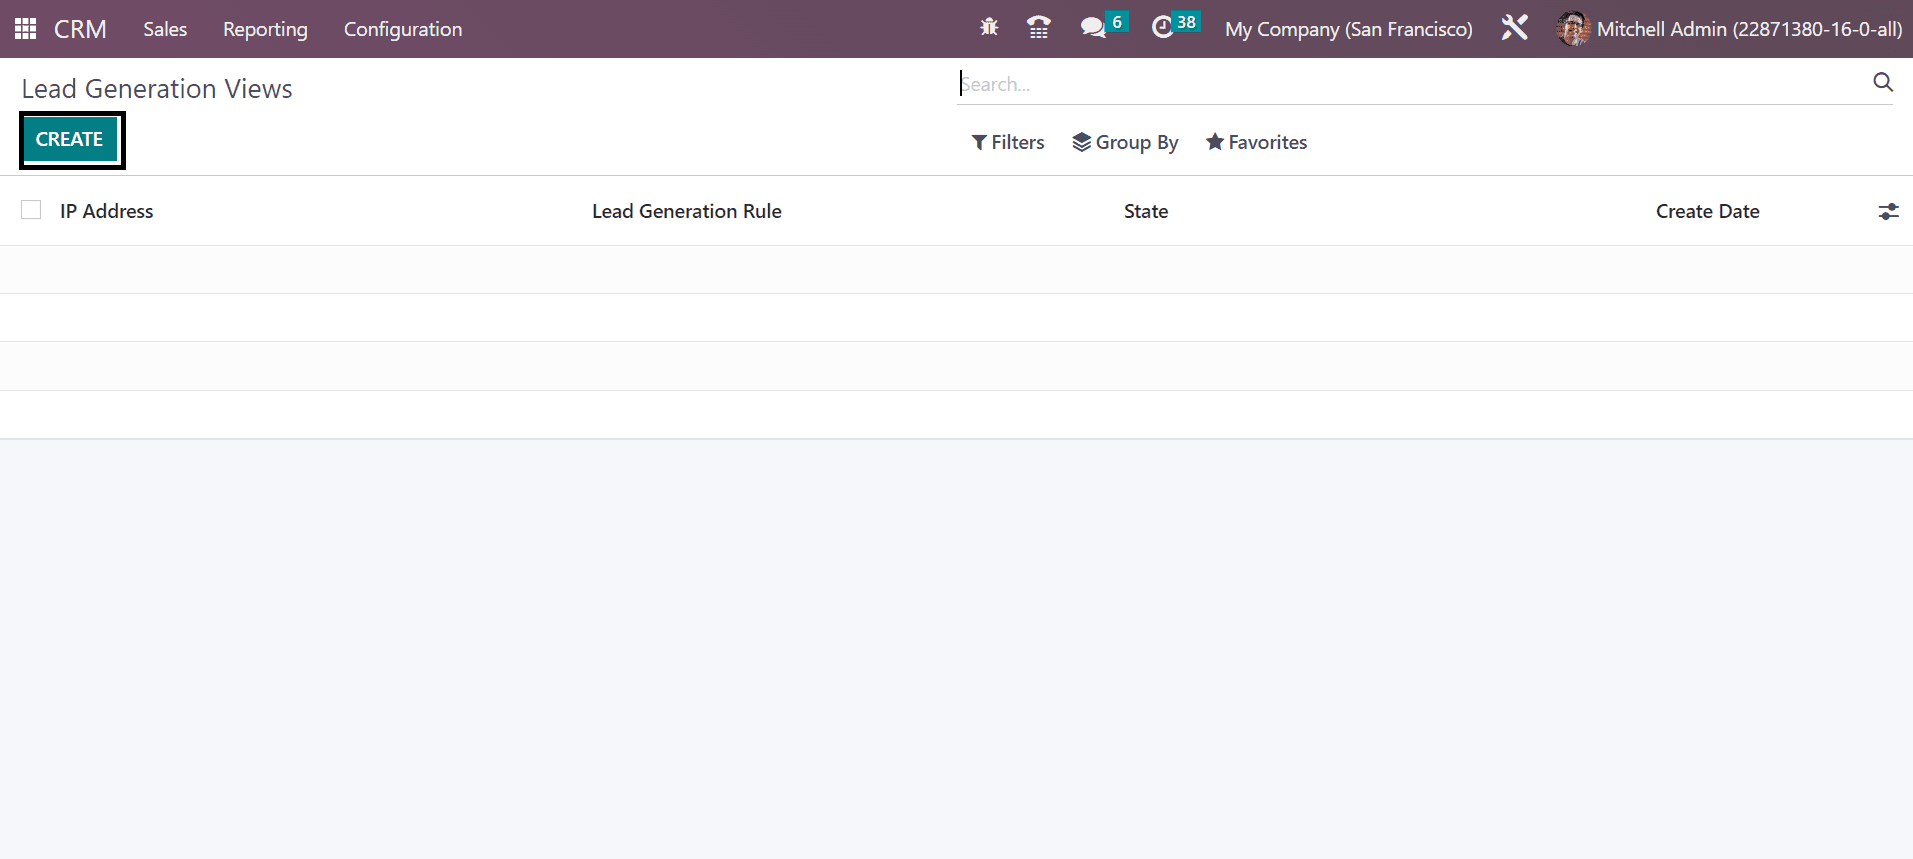
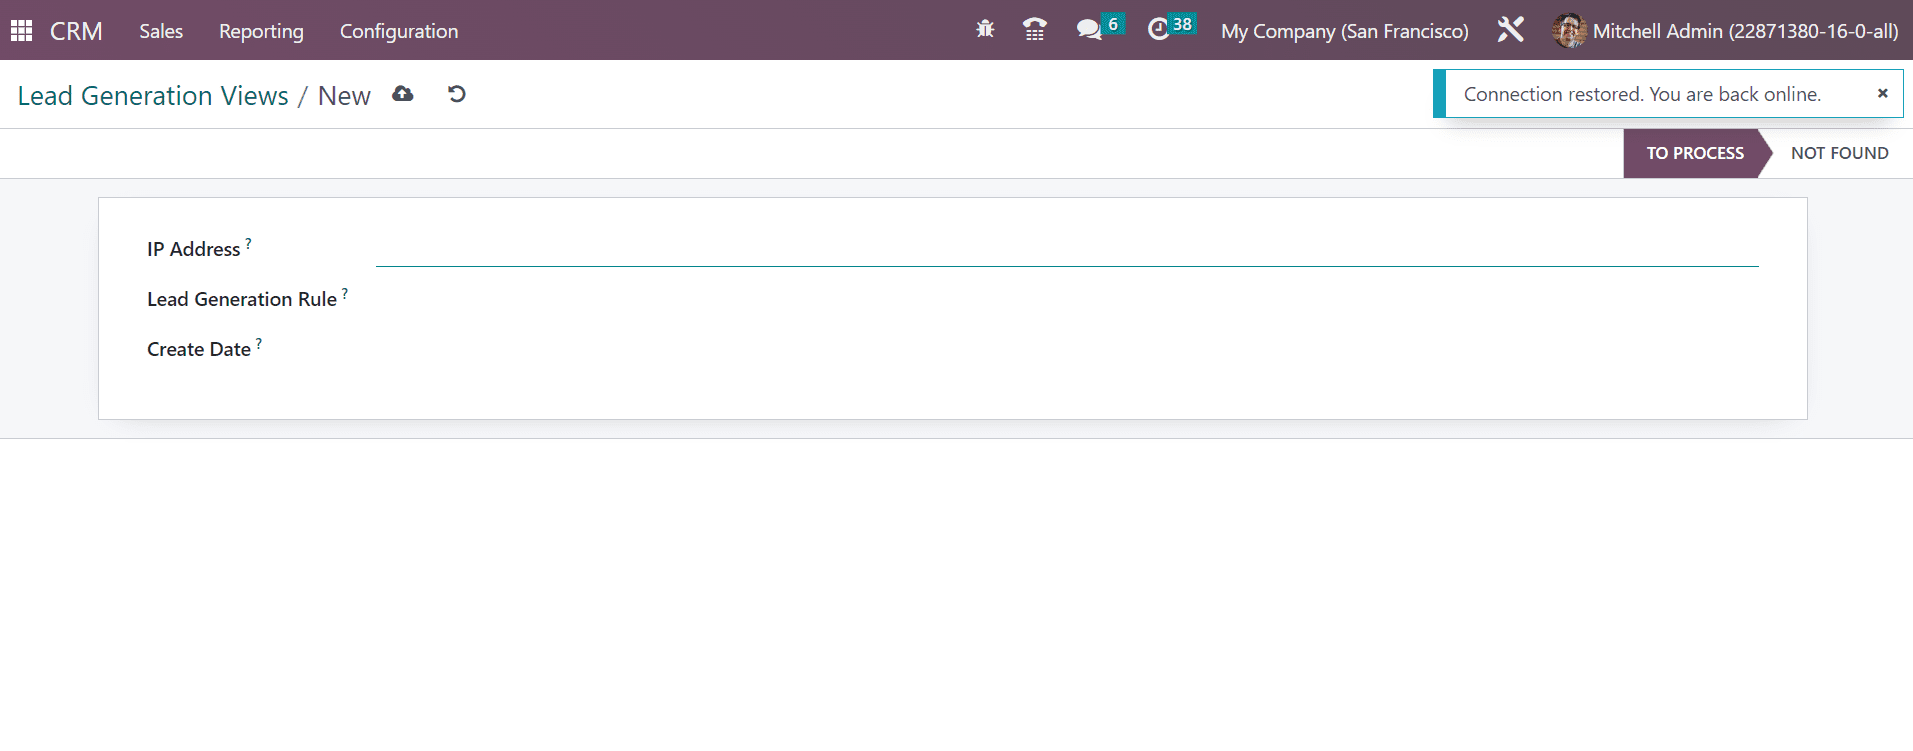
On selecting this Lead Generation View, you will get a page to create a new lead generation view with an option of CREATE button in it. There you have to give the IP Address, the Lead generation rule that you are going to create, and the date on which you are creating this lead generation view, respectively.
The CRM Module in this Odoo Software provides you with a wide variety of features that help you to manage leads from the formation of leads to the final conversion to the successful selling of the product. In order to get such kind of software for all your needs related to sales, then you can go for this CRM Module provided by Odoo Software.